Forex Super Signals Channel Trading System with Parabolic SAR and Fractal – The parabolic SAR is a popular indicator that is mainly used by traders to determine the future short-term momentum of a given asset. The calculation of this indicator is rather complex and goes beyond the scope of how it is practically used in trading.


The Parabolic SAR indicator is graphically shown on the chart of an asset as a series of dots placed either above or below the price (depending on the asset’s momentum).
A small dot is placed below the price when the trend of the asset is upward, while a dot is placed above the price when the trend is downward.
As you can see from the chart below, transaction signals are generated when the position of the dots reverses direction and is placed on the opposite side of the price as it was earlier.
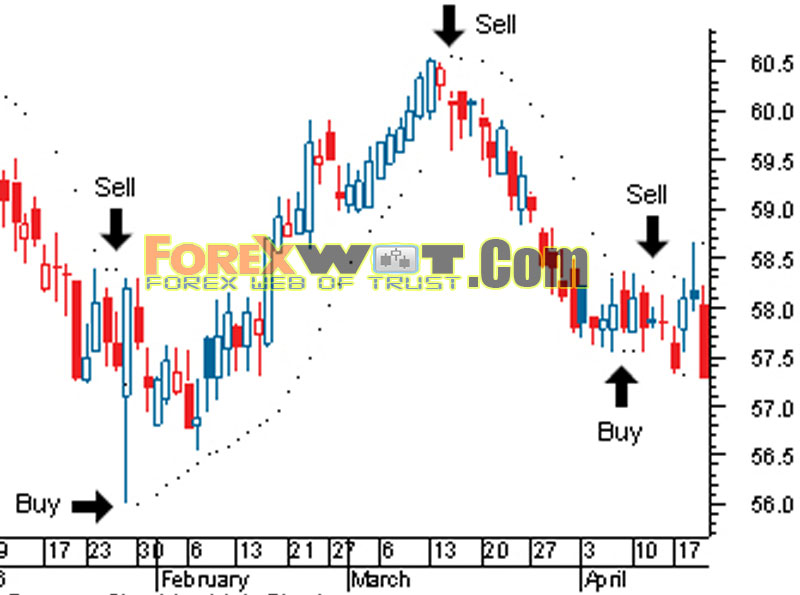
Basically, if the stock is trading below the parabolic SAR (PSAR) you should sell. If the stock price is above the SAR then you should buy (or stay long).
Using this indicator by itself can often lead to entering/exiting a position prematurely. Many traders will choose to place their stop loss orders at the SAR value because a move beyond this will signal a reversal, causing the trader to anticipate a move in the opposite direction.
What Are Fractals…?
When many people think of fractals in the mathematical sense, they think of chaos theory and abstract mathematics. While these concepts do apply to the market (it being a nonlinear, dynamic system), most traders refer to fractals in a more literal sense. That is, as recurring patterns that can predict reversals among larger, more chaotic price movements.
These basic fractals are composed of five or more bars. The rules for identifying fractals are as follows:
- A bearish turning point occurs when there is a pattern with the highest high in the middle and two lower highs on each side.
- A bullish turning point occurs when there is a pattern with the lowest low in the middle and two higher lows on each side.
The fractals shown in Figure below are two examples of perfect patterns. Note that many other less perfect patterns can occur, but the basic pattern should remain intact for the fractal to be valid.

The obvious drawback here is that fractals are lagging indicators – that is, a fractal can’t be drawn until we are two days into the reversal.
Here are a few things to remember when using fractals:
- They are lagging indicators. They are best used as confirmation indicators to help confirm that a reversal did take place. Real-time tops and bottoms can be surmised with other techniques.
- The longer the time period (i.e. the number of bars required for a fractal), the more reliable the reversal. However, you should also remember that the longer the time period, the lower the number of signals generated.
- It is best to plot fractals in multiple time frames and use them in conjunction with one another. For example, only trade short-term fractals in the direction of the long-term ones. Along these same lines, long-term fractals are more reliable than short-term fractals.
- Always use fractals in conjunction with other indicators or systems. They work best as decision support tools, not as indicators on their own.
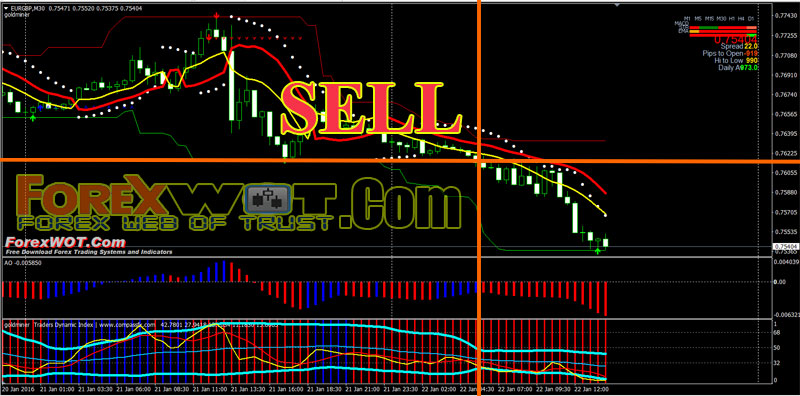
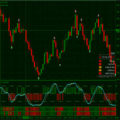
This Most Successful Forex Super Signals Channel Trading System based on two repaint price action forex indicators: ArzzX2 Fractal indicator and Super Signals Channels Indicator. These repaint indicators price action, are balanced by indicators that do not repaint.
- Best Time Frame : 15 min or higher
- Currency pair: major.
Metatrader indicators:
- Super signals channel indicator;
- ArZZx2 indicator;
- Awesome indincator;
- Parabolic Sar indicator (0.03; 02);
- Goldminer 2 indicator,
- Traders Dynamic Index,
- SSL Channel Chart Alert
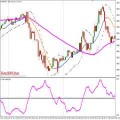
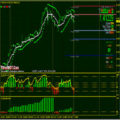
- Super signals channel : arrow blue;
- ArZZx2 indicator: green arrow with support;
- Parabolic Sar below the price;
- Awesome blue bars;
- Goldminer 2 indicator blue bars,
- Price above SSL Channel Chart Alert,
- Traders Dynamic Index upward.

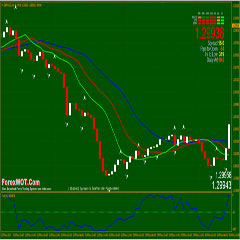
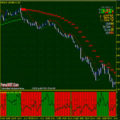
- Super signals channel : arrow red;
- ArZZx2 indicator: red arrow with resistance;
- Parabolic Sar above the price;
- Awesome red bars;
- Goldminer 2 indicator red bars,
- Price below SSL Channel Chart Alert,
- Traders Dynamic Index downward.
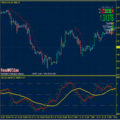
- When Parabolic Sar changes direction or fast profit target.
- Place initial stop loss 3 pips above or below the channel.
As you can see, fractals can be extremely powerful tools when used in conjunction with other indicators and techniques, especially when used to confirm reversals.
 The Best Forex Binary Options Parabolic Sar Strategy with TDI and Escalda Trend Signal Indicator
 Forex Daily Time Frame Trading with Advanced Parabolic Trend Following System and Strategy
 Forex High Profits High Accuracy Parabolic SAR System with Simple Moving Average and ATR Ratio (SAR)
 Forex Parabolic SAR Trading Strategy with Day Week Month Range Indicator
 Forex Parabolic SAR (Stop And Reversal) Trading System : How To Use Parabolic SAR Indicator Effectively
 How To Trade High Accuracy Bill Williams Fractals Alligator Trading System
 Forex PARA TDI Trading System
 Forex Reversal & Fractals Strategy (A Trader’s Guide to Using Fractals Effectively) [9116]
 MTF Parabolic SAR Trading System and Strategy
 Foreign Exchange Trading : Online Forex Master Level Trading System and Strategy
