The Heikin-Ashi technique is used by technical traders to identify a given trend more easily. Hollow candles with no lower shadows are used to signal a strong uptrend, while filled candles with no higher shadow are used to identify a strong downtrend.

This technique should be used in combination with standard candlestick charts or other indicators to provide a technical trader the information needed to make a profitable trade.
Top 10 Forex Heiken Ashi Trading System and Strategy
There are five primary signals that identify trends and buying opportunities:
- Hollow candles with no lower “shadows” indicate a strong uptrend: let your profits ride!
- Hollow candles signify an uptrend: you might want to add to your long position, and exit short positions.
- One candle with a small body surrounded by upper and lower shadows indicates a trend change: risk-loving traders might buy or sell here, while others will wait for confirmation before going short or long.
- Filled candles indicate a downtrend: you might want to add to your short position, and exit long positions.
- Filled candles with no higher shadows identify a strong downtrend: stay short until there’s a change in trend.
These signals show that locating trends or opportunities becomes a lot easier with this system. The trends are not interrupted by false signals as often, and are thus more easily spotted. Furthermore, opportunities to buy during times of consolidation are also apparent. Below are Top 10 Forex Heiken Ashi Trading System and Strategy:
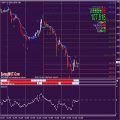
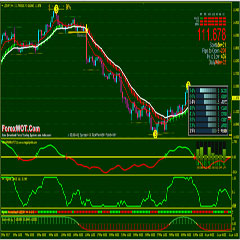
1. Forex Super Woodie CCI Trading Strategy with Heiken Ashi
Forex High Profits Super Woodie CCI Trading Strategy with Momentum and Heiken Ashi or SHA Trend Finder – This system is not about you and how you want to trade. It is about you following the rules. The system works perfectly time and time again. Just follow these guidelines to Woodies CCI and you will make tremendous progress in your trading.
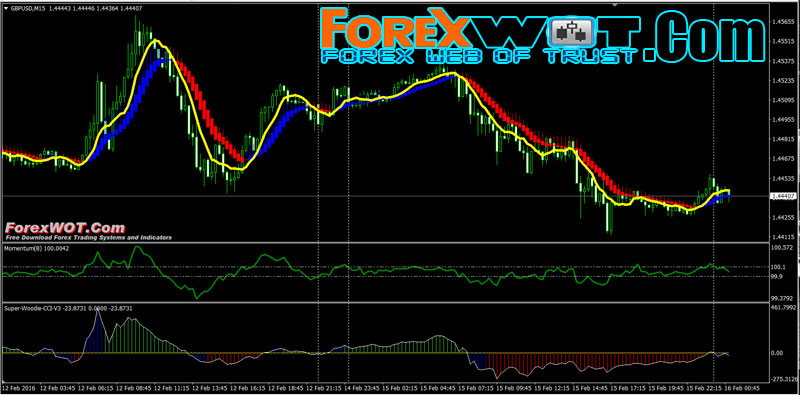
Do not make trading Woodies CCI system hard just because you are used to making trading hard. There is no reason it should be. If you choose to make it complex then you will be defeating the goal of trading and not taking advantage of the simplicity of Woodies CCI system.
Woodies CCI system is like no other system in the world. It’s simple. It is complete. It is precise. It is clear. It’s unambiguous. And because of that peopleget confused even easier it seems. So leave your brain on the pillow before you get out of bed to trade. You will do far better without it. There are no conflicting signals in Woodies CCI. Do not get confused. There is nothing for you to guess about.
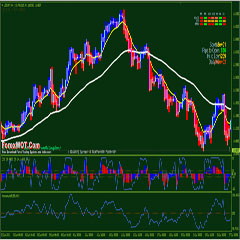
2. Forex Heiken Ashi Moving Average Trading System
Simple and high profits Forex Heiken Ashi Moving Average Trading System. The purpose of Heiken Ashi Smoothed Charts is to filter noise and provide a clearer visual representation of the trend.
For new traders the trend is easier to see, and for experienced traders the Heiken Ashi Smoothed Cart help keep them in trending trades and able to spot spot reversals, while still being able to see traditional chart pattern setups.
Heikin-Ashi Smoothed Charts help traders view trends and spot potential reversals. Therefore, they are most applicable to trend traders.
Heiken-Ashi Smoothed Candles use the open/close values from the prior period and the open-high-low-close values from the current period to create a special Haiken Ashi Smoothed Candle. The result is filtered candlestick out of some noise in an effort to better capture the trend.
Heikin-Ashi Smoothed represents the average-pace of prices. Heikin-Ashi Smoothed Candles are not used like normal candlesticks. Multiple of buy or sell reversal patterns consisting of 1-3 candles are not found. But instead, these candlesticks can be used to identify trending periods, potential reversal points and classic technical analysis patterns.
The Heikin-Ashi Smoothed technique is really useful for making candlestick charts more readable, trends can be detected and found a lot more easily, and buying/selling opportunities can be spotted at a glance. When you use Heiken Ashi Smoothed Indicators properly, this technique can help you spot trends and trend changes from which you can gain some pips!…
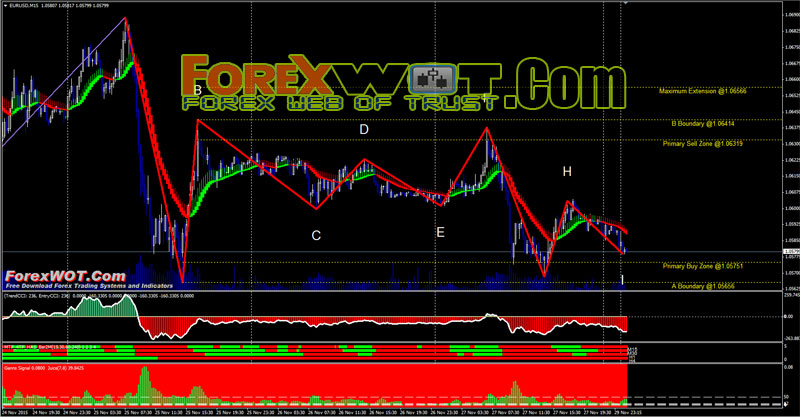
3. Double CCI Retracement Forex Trading Method with Heiken Ashi Smoothed
CCI Trading Strategy – Double CCI Forex Trading Method with Heiken Ashi Smoothed. The CCI has seen substantial growth in popularity amongst technical investors; today’s traders often use the indicator to determine cyclical trends in not only commodities, but also equities and currencies.
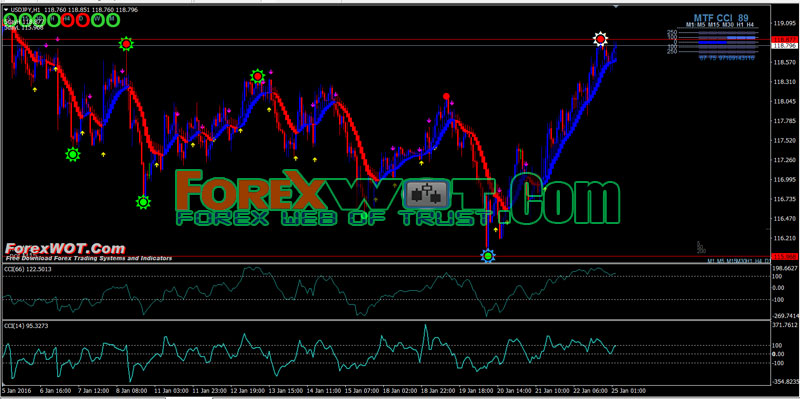
The CCI, when used in conjunction with other oscillators, can be a valuable tool to identify potential peaks and valleys in the asset’s price, and thus provide investors with reasonable evidence to estimate changes in the direction of price movement of the asset.
CCI measures the statistical variation from the average. It is an unbounded oscillator that generally fluctuates between +100 and -100. Traders use the CCI in a variety of ways. Three common uses are:
- CCI in retracements
- CCI on breakouts
- CCI in divergent trades
This article will be the first of three regarding common uses of CCI and will focus on how to use this oscillator in retracements.
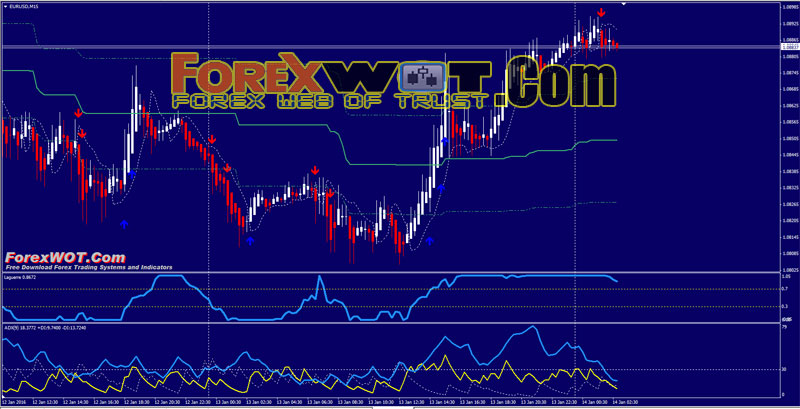
4. Heiken Ashi Laguerre Trading System and Strategy
High Profits Forex Heiken Ashi Laguerre Trading System and Strategy – Heikin-Ashi chart looks like the candlestick chart, but the method of calculation and plotting of the candles on the Heikin-Ashi chart is different from the candlestick chart.
In candlestick charts, each candlestick shows four different prices: Open, Close, High and Low price. Every single candlestick is independent from others and has no relation with the previous or next candlestick.
On the opposite, Heikin-Ashi candles are calculated and plotted using some information from the previous candle:
- Open price: the open price in a Heikin-Ashi candle is the average of the open and close of the previous candle. [Open (previous bar) + Close (previous bar)]/2
- Close price: the close price in a Heikin-Ashi candle is the average of open, close, high and low prices. (Open+High+Low+Close)/4
- High price: the high price in a Heikin-Ashi candle is chosen from one of the high, open and close price of which has the highest value. Max (High,Open,Close)
- Low price: the low price in a Heikin-Ashi candle is chosen from one of the high, open and close price of which has the lowest value. Min (Low,Open, Close)
So the candles of Heikin-Ashi chart are related to each other because the open price of each candle should be calculated using the previous candle close and open prices, and also the high and low price of each candle is affected by the previous candle.
That’s why a Heikin-Ashi chart is slower than a candlestick chart and its signals are delayed.
When plotting this type of chart it provides a little bit of lag but not near the lag as in a moving average as shown in the thumbnail. Thus, it gets you in the trade quickly and keeps you in just until the trend reverses. Lets look at the simple trade set up and follow through:
- The trigger is having two same colored bars in the same direction.
- The exit is when you have one colored bar in the opposite direction.
If you noticed in the normal 5 minute chart following the same period you would have had several false stop signals. Using different time frames you may use this to help guide you on the trade trigger or help you stay in a trade longer to let your profits runs. Experiment and let us know how you have done …
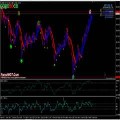
5. Heiken Ashi Intraday Trading System
Heiken Ashi Kuskus Trading System – How to Become a Successful Forex Trader With Heiken Ashi Kuskus Intraday Trading System. Heiken Ashi Kuskus Scalping is a very profitable intraday trading system. This strategy is trend following. Best Time Frame : 15min. Best Currency pairs : majors, and indicies. Best Sessions : London and New York.

The Heikin-Ashi technique is extremely useful for making candlestick charts more readable–trends can be located more easily, and buying opportunities can be spotted at a glance.
The charts are constructed in the same manner as a normal candlestick chart, with the exception of the modified bar formulas. When properly used, this technique can help you spot trends and trend changes from which you can profit!
There are five primary signals that identify trends and buying opportunities:
- Hollow candles with no lower “shadows” indicate a strong uptrend: let your profits ride!
- Hollow candles signify an uptrend: you might want to add to your long position, and exit short positions.
- One candle with a small body surrounded by upper and lower shadows indicates a trend change: risk-loving traders might buy or sell here, while others will wait for confirmation before going short or long.
- Filled candles indicate a downtrend: you might want to add to your short position, and exit long positions.
- Filled candles with no higher shadows identify a strong downtrend: stay short until there’s a change in trend.
These signals show that locating trends or opportunities becomes a lot easier with this system. The trends are not interrupted by false signals as often, and are thus more easily spotted. Furthermore, opportunities to buy during times of consolidation are also apparent.
6. Scalping Trading System With Heiken Ashi and Stochastic oscillator
Free Easy Accurate Forex ScalpingTrading System – Scalping indicator system is a trend following trading system for intraday trading. On line there are various setup of this system.
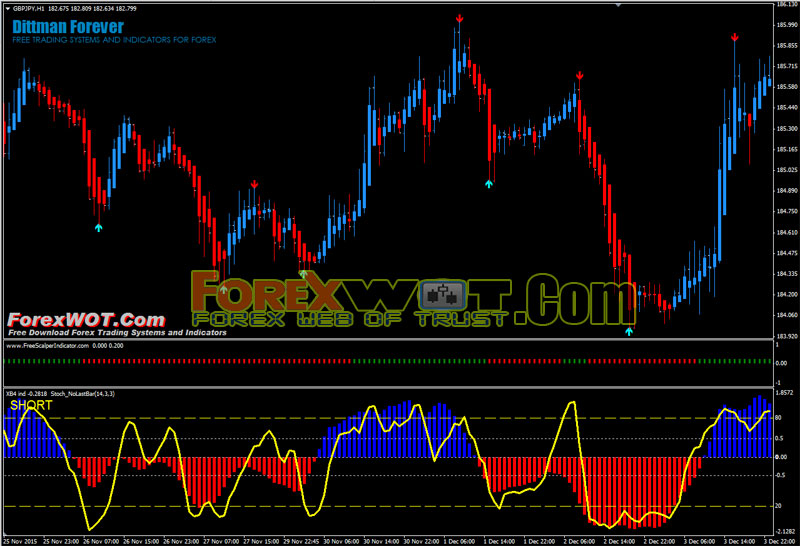
Time Frame : 1 min, 5 min. 15Min.
Markets currency pairs (majors) and Indicies.
- Identify a current trend. (Remember? Trend is your friend?)
- Ignore all signals against a currenttrend!
7. Heiken Ashi Simple Moving Average Crossover Trading Strategy
Forex Heiken Ashi Simple Moving Average Crossover Trading Strategy – The simple moving average is probably one of the most basic forms of technical analysis. Even hard core fundamental guys will have a thing or two to say about the indicator. A trader has to be careful, since there are unlimited number of averages you can use and then you throw the multiple time frames in the mix and you really have a messy chart.

Below is a play-by-play for using a moving average on an intraday chart. In the below example we will cover staying on the right side of the trend after putting on a long position.
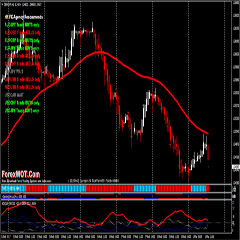
8. Kuskus Heiken Ashi Moving Average Trading System
High Profits Forex Trading System and Strategy – This Forex Kuskus Heiken Ashi Moving Average Trading System is a trend-momentum forex strategy because it is composed of trend indicators and momentum indicators.
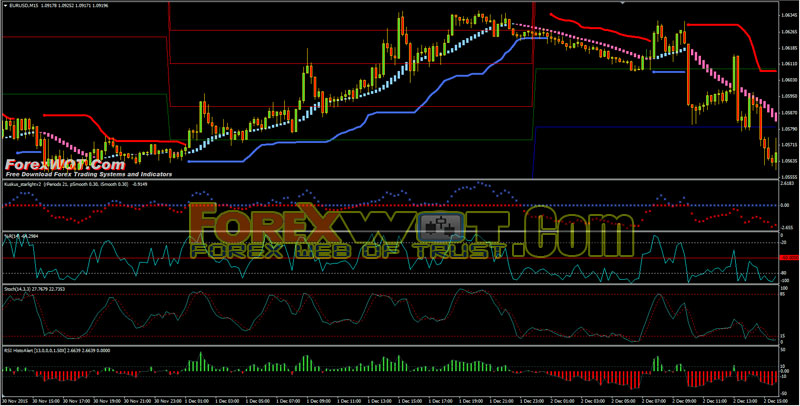
Best Time Frame: 15 min or higher.
Currency pair: any.
Forex Kuskus Heiken Ashi Moving Average Indicators:
- Bollinger Bands Stop indicator (15, 2);
- RSI histo Indicator (14 period) + 2 levels (+12, -12);
- William’s percent range (14 Period);
- Starlight indicator (rperiods 21, p.smooth 0.30, ismooth 0.30);
- Hama (Heiken Ashi Moving Average) pad V.2 (3 ,21,3) optional;
- Stochastic indicator (14,3,3,);
- Pivot Points Daily.
The main indicators in this trading system are Kuskus, HAMA, and RSI Histo. The relative strength index (RSI) is a technical indicator used in the analysis of financial markets. It is intended to chart the current and historical strength or weakness of a stock or market based on the closing prices of a recent trading period. The indicator should not be confused with relative strength.
The RSI is classified as a momentum oscillator, measuring the velocity and magnitude of directional price movements. Momentum is the rate of the rise or fall in price. The RSI computes momentum as the ratio of higher closes to lower closes: stocks or currency which have had more or stronger positive changes have a higher RSI than stocks or currency which have had more or stronger negative changes.
The RSI is most typically used on a 14-day timeframe, measured on a scale from 0 to 100, with high and low levels marked at 70 and 30, respectively. Shorter or longer timeframes are used for alternately shorter or longer outlooks. More extreme high and low levels—80 and 20, or 90 and 10—occur less frequently but indicate stronger momentum. But in this RSI Histo we use 10 and -10 level to catch trend.
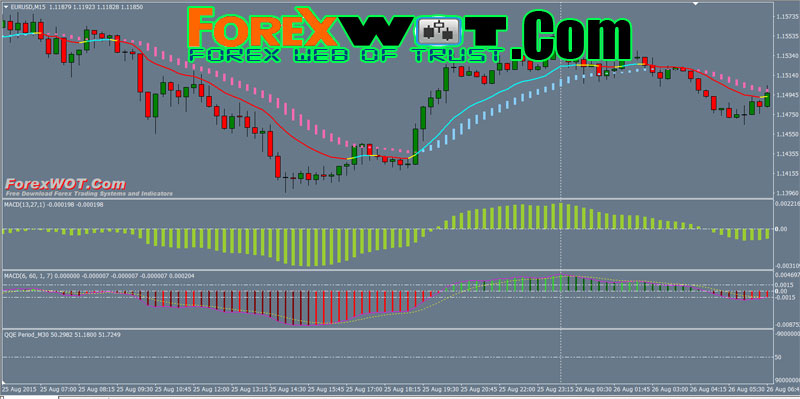
9. BBwin MACD Trading System with Heiken Ashi
Forex BBwin MACD Trading System is a trend folllowing Trading System and it’s based on BBwin MACD and Heiken Ashi indicator. This Forex Trading system is very simple but very-very effective.

Moving Average Convergence Divergence ( MACD ) is an extremely popular indicator used in technical analysis. MACD can be used to identify aspects of a security’s overall trend. Most notably these aspects are momentum, as well as trend direction and duration.
There are three common methods used to interpret the MACD:
- Crossovers – As shown in the chart above, when the MACD falls below the signal line, it is a bearish signal, which indicates that it may be time to sell. Conversely, when the MACD rises above the signal line, the indicator gives a bullish signal, which suggests that the price of the asset is likely to experience upward momentum. Many traders wait for a confirmed cross above the signal line before entering into a position to avoid getting getting “faked out” or entering into a position too early, as shown by the first arrow.
- Divergence – When the security price diverges from the MACD. It signals the end of the current trend.
- Dramatic rise – When the MACD rises dramatically – that is, the shorter moving average pulls away from the longer-term moving average – it is a signal that the security is overbought and will soon return to normal levels.
10. Forex Heiken Ashi Smoothed Trend Trading System
Forex Heiken Ashi Smoothed Trend Trading System is an trend following trading system based on the Heiken Ashi Smoothed, MTF 4TF Has indicator and Double CCI indicator.
The Heikin-Ashi Smoothed technique is used by technical traders to identify a given trend more easily. Hollow candles with no lower shadows are used to signal a strong uptrend, while filled candles with no higher shadow are used to identify a strong downtrend.
This technique should be used in combination with standard candlestick charts or other indicators to provide a technical trader the information needed to make a profitable trade.
 FREE DOWNLOAD 20+ Best Forex MACD-Moving Average Trading System
 ZMA Heiken Ashi System – Easy Way To Identify The Direction Of The Trend
 Super Effective Follow Trend Trading with Heiken Ashi Profit Supreme
 Foreign Exchange Currency Trading – Double CCI Retracement Forex Trading Method with Heiken Ashi Smoothed (HA)
 Forex Trading Course – How To Trade Foreign Exchange Market With TREND SQUEEZER Heiken Ashi Trading System
 Learn Online Forex Trading – How To Easily Trade Forex With Heiken Ashi
 Forex and Crypto “MORNING TRADE” Trading Strategy for Advanced Traders
 FREE DOWNLOAD Top 10+ Best Forex Trading Systems for Beginners
 Best Forex & Binary Options 4 Hour Strategy with Heiken Ashi EMA Trend Following System
 How to Predict Forex Markets Accurately with Heiken Ashi BG, PCCI PRSI, and Momentum Indicator

Hallo,
I have a question regarding the trendalt_Alert indicator. Is it possible that you send the original code to me. Perhaps I can change the code to prevent the repainting!?
best regards
Markus