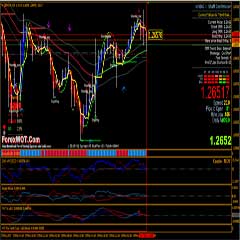
Forex Multiple Time Frame (MTF) EMA Trading Strategy – Trading Daily Weekly Exponential Moving Average Price Action for Massive Profits. I want to share a really simple EMA Daily Weekly trading system or strategy for H4 and Daily time frames trading.


In this Multi Time Frame Exponential Moving Average Strategy we use 14EMA for H4, Daily and Weekly. But the trading system works well on Daily time frame.
The MTF Moving Average Indicator displays the moving average of a higher timeframe on the chart.
The indicator parameters
- TimeFrame – time frame of the moving average (drop-down list)
- MA Period – moving average period
- MA Method – moving average method (drop-down list)
- MA Shift – moving average shift
- MA Price – moving average price (drop-down list)
How to Use Multiple Time Frame Exponential Moving Average Analysis to Find Better ENTRY and EXIT Points?…
Don’t try to get your face closer to the market, but push yourself further away.
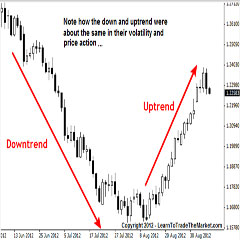
You have to remember, a trend on a longer time frame has had more time to develop, which means that it will take a bigger market move for the pair to change course.
There you can make a strategic decision to go long or short based on whether the market is ranging or trending.
- Best Time Frames: Daily
- Most Recommended Currency Pairs: GBPUSD, EURUSD, UDJPY, and All Currency Pairs
- MTF Moving Average (MTFMA)
- Relative Strength Index
- Williams’ Percent Range
- Signal Trend
- AARZZ
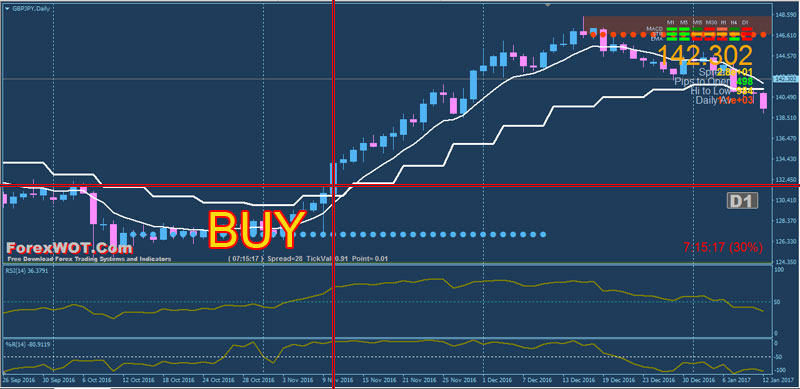
- Price above MTF EMA Daily and MTF EMA Weekly
- Blue color AARZZ indicator below the previous swing low
- RSI line upward above 50 level
- Williams’ Percent Range line upward above -50 level
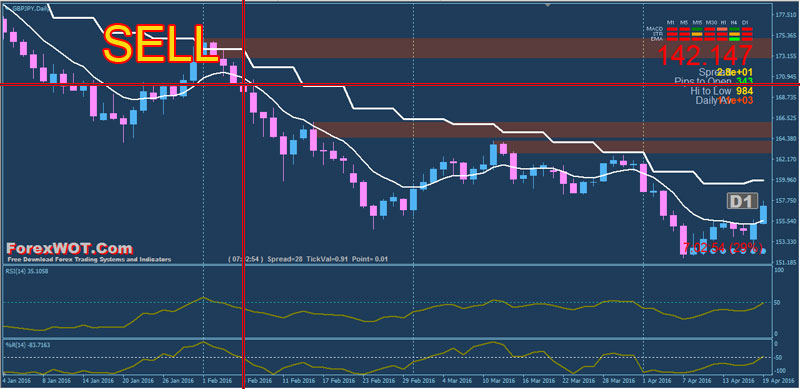
- Price below MTF EMA Daily and MTF EMA Weekly
- Red color AARZZ indicator aove the previous swing high
- RSI line downward below 50 level
- Williams’ Percent Range line downward below -50 level
What time frames should you be tracking?
A general rule is that the longer the time frame, the more reliable the signals being given. As you drill down in time frames, the charts become more polluted with false moves and noise.
Ideally, traders should use a longer time frame to define the primary trend of whatever they are trading.
Once the underlying trend is defined, traders can use their preferred time frame to define the intermediate trend and a faster time frame to define the short-term trend. Some examples of putting multiple time frames into use would be:
- A swing trader, who focuses on DAILY charts for his or her decisions, could use WEEKLY charts to define the primary trend and 60-minute charts to define the short-term trend.
- A day trader could trade off of 15-Minute charts, use 60-Minute charts to define the primary trend and a five-minute chart (or even a tick chart) to define the short-term trend.
- A long-term position trader could focus on WEEKLY charts while using MONTHLY charts to define the primary trend and daily charts to refine entries and exits.
This “ForexWOT Trading Daily Weekly Multiple Time Frame EMA” is very easy, simple, and extremely high accuracy if you discipline to the rules.
[sociallocker]
[/sociallocker]
 Forex High-Probability Multiple Time Frames Trading and Analysis
 FREE DOWNLOAD 20+ Best Forex MACD-Moving Average Trading System
 TOP10 BEST Full Time Forex Trader Trading System and Strategy
 Best Forex H4-Weekly Multiple Time Frame System Analysis to Find Better Entry and Exit Points
 Top 10 Best Easy Simple and High Accuracy Low Drawdown Forex Trading Systems
 Forex Daily Weekly Open Trading Strategy With EMA 55 Channel and BUY SELL Signals
 MA COBRA Forex & Stocks Trading Strategy (Extremely Low Risk High Reward Trading Strategy) (COBRA SYSTEM)
 The Biggest Lessons You Have to Learn as a Forex-Currency Trader
 3 Best AMAZING Forex Trend Trading Strategy
 Foreign Exchange Trading : Online Forex Master Level Trading System and Strategy
