FREE DOWNLOAD Trend Trading System – Trading the Trend Momentum with Heiken Ashi BBands Stop Analysis. The Heikin Ashi is available on some charting packages as a separate indicator. This allows investors or speculators to make a side-to-side comparison between the standard candlestick and the Heikin Ashi, allowing for a more cohesive interpretation.


The Heiken Ashi candlestick chart looks like the real candlestick chart but there’s a difference:
- In a candlestick chart, each candlestick has four different prices which are: open, high, low & close. Each candlestick that is formed after has not relationship with the one the formed previously.
- But with heikin ashi candlestick, each candlestick is calculated using some information from the previous candlestick.
If you wan’t to know more here is a brief detail of how the heiken ashi candlesticks calculated and plotted:
- Open price = average of the open and close of the previous candlestick.
- High price = is chosen from the one of the high, open and close price of which has the highest value.
- Low price = is chosen from the one of the high, open and close price which has the lowest value
- Close price = is the average of the open, close, high and low prices.
What that means is that each candlestick is formed on the heiken ashi chart is related to the previous one before it.
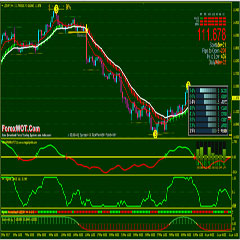
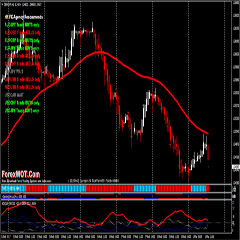
Trading the Trend Momentum with Heiken Ashi Candlesticks and BBands Stop Analysis is a forex strategy that is based on the Heiken Ashi Candlestick, momentum,BBands Stop, and MACD. This Forex Trend Momentum strategy allows you to stay in with the trend because heiken ashi candlesticks, by their nature, they eliminate all the noise that happens in regular candlesticks.
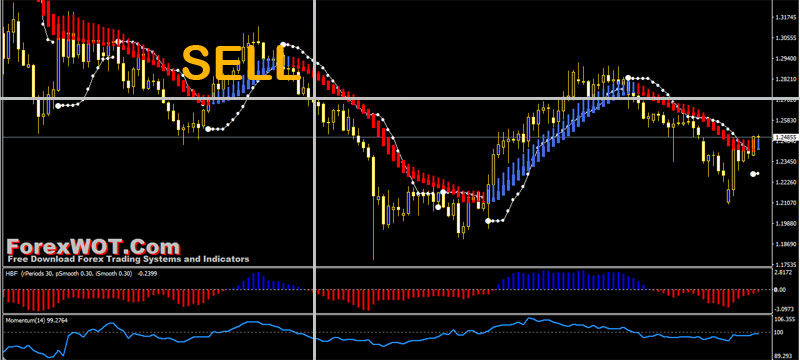
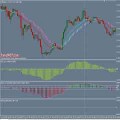
- Momentum line below 100 level.
- HBB dots above the price candles.
- HBA candles turn into red.
- HBF bars goes below 0 line and turns into red bars.
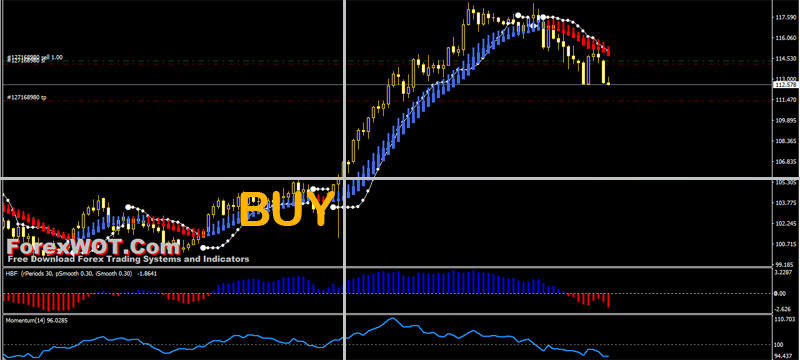
- Momentum line above 100 level.
- HBB dots below the price candles.
- HBA candles turn into blue.
- HBF bars goes above 0 line and turns into blue bars.
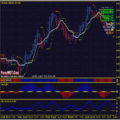
Only enter trade with all 4 indicator confirmation for perfect signal.
You should put stop loss on previous candle high or low.
Also trailing stop could be applied.
We simply exit trade when HBB indicator changes color against our trade.
 Top 10 Super Effective High Profits Forex Heiken Ashi Trading System and Strategy
 Super Effective Follow Trend Trading with Heiken Ashi Profit Supreme
 Learn Online Forex Trading – How To Easily Trade Forex With Heiken Ashi
 How to succeed at Forex Trading with Heiken Ashi Laguerre Trading System and Strategy (HeikenAshi)
 ZMA Heiken Ashi System – Easy Way To Identify The Direction Of The Trend
 Best Forex & Binary Options 4 Hour Strategy with Heiken Ashi EMA Trend Following System
 FREE DOWNLOAD 20+ Best Forex MACD-Moving Average Trading System
 Forex Trading Course – How To Trade Foreign Exchange Market With TREND SQUEEZER Heiken Ashi Trading System
 Forex Heiken Ashi Moving Average Trading System with Multi MACD and QQE Period Indicator (MACD)
 Heiken Ashi ADX System – Best Forex Trading Strategy for Consistent Profits
