The Best EMA Trading Strategy. 8, 13, 21 EMA Strategy – this is how to Day Trade Successfully. By the time you finish this tutorial, you’ll know exactly when to enter high probability trade using the Exponential Moving Averages analysis.


Three different periods (5, 8,and 13) EMA will help you to identify trends at the beginning when it starts to form.
It works fine at any time frame chart of the financial assets. You can create a complete trading strategy by using these EMA signal lines. For more accuracy, you can combine these EMA signal lines with other technical indicators such as parabolic SAR, MACD, or RSI.
In our short-term trading strategy, we use the combination of 5, 8, and 13 EMA and parabolic SAR. This strategy will work fine in the hourly chart of any market. We suggest choosing currency pairs or trading assets that involve sufficient volatility if you want to make frequent trading positions.
- Download “ForexWOT-EMAparabolicSAR” (Zip/RAR File).
- Copy mq4 and ex4 files to your Metatrader Directory …/experts/indicators/
- Copy the “ForexWOT-EMAparabolicSAR.tpl” file (template) to your Metatrader Directory …/templates /
- Start or restart your Metatrader Client.
- Select Chart and Timeframe where you want to test your forex system.
- Right-click on your trading chart and hover on “Template”.
- Move right to select “ForexWOT-EMAparabolicSAR” trading system and strategy.
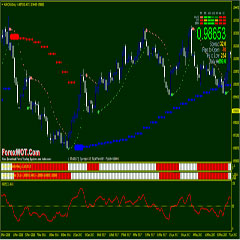
- You will see the “EMA Parabolic SAR” is available on your Chart.
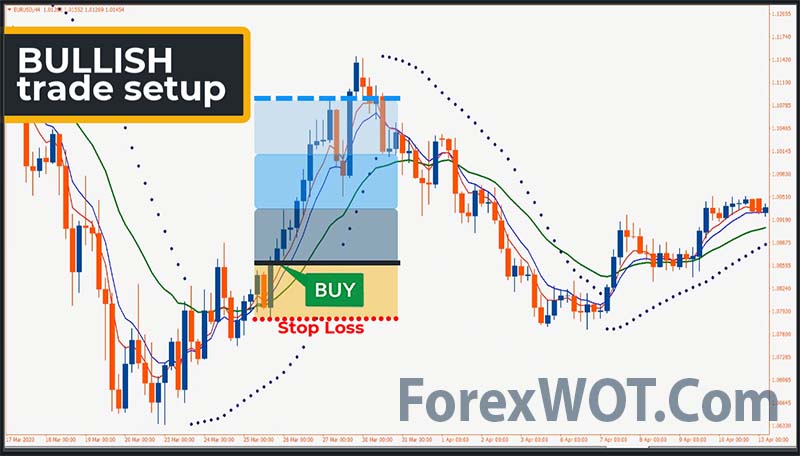
- The red (5) EMA line crosses above the Green (13) and blue (8) signal line.
- The blue (8) signal line crosses above the green (13) signal line.
- The parabolic SAR dot appears below price candles.
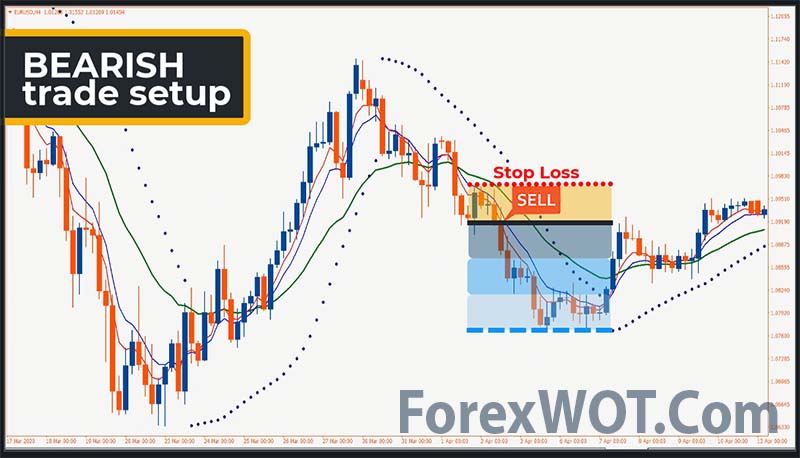
- The red (5) EMA line crosses below the Green (13) and blue (8) signal lines.
- The blue (8) signal line crosses below the green (13) signal line.
- The parabolic SAR dot appears above price candles.
When both the red and blue EMA signal lines cross above the green EMA, it indicates fully bullish price movement on the asset price. The exact opposite crossover occurs between the EMA signal lines when the price movement shifts to a bearish trend.
Parabolic SAR indicates the trends by signal dots. Those dots change states and continue to appear on the same side till the trend remains intact.
We use MACD in combination with 5, 8, and 13 EMA lines in our long-term trading strategy. EMA lines will act the same as the short-term strategy. This strategy works fine in any time frame chart; we recommend using the daily chart.
- Download “ForexWOT-EMAnMACD” (Zip/RAR File).
- Copy mq4 and ex4 files to your Metatrader Directory …/experts/indicators/
- Copy the “ForexWOT-EMAnMACD.tpl” file (template) to your Metatrader Directory …/templates /
- Start or restart your Metatrader Client.
- Select Chart and Timeframe where you want to test your forex system.
- Right-click on your trading chart and hover on “Template”.
- Move right to select “ForexWOT-EMAnMACD” trading system and strategy.
- You will see the “EMA and MACD” is available on your Chart.
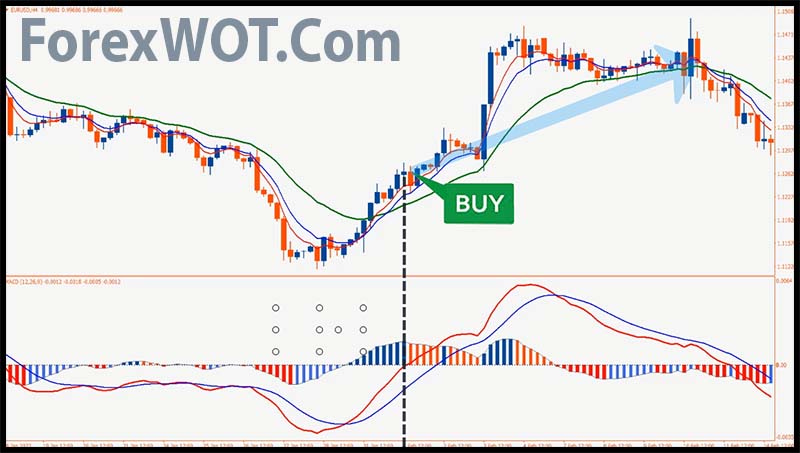
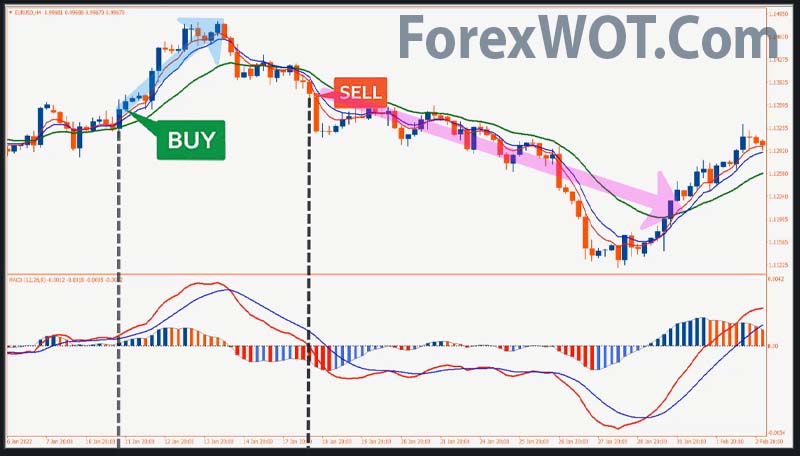
- A bullish crossover occurs between the EMA signal lines.
- The blue signal line crosses above the red signal line, and both lines are heading toward the upside in the MACD indicator window.
- MACD histogram bars appear above the middle line of the MACD window.
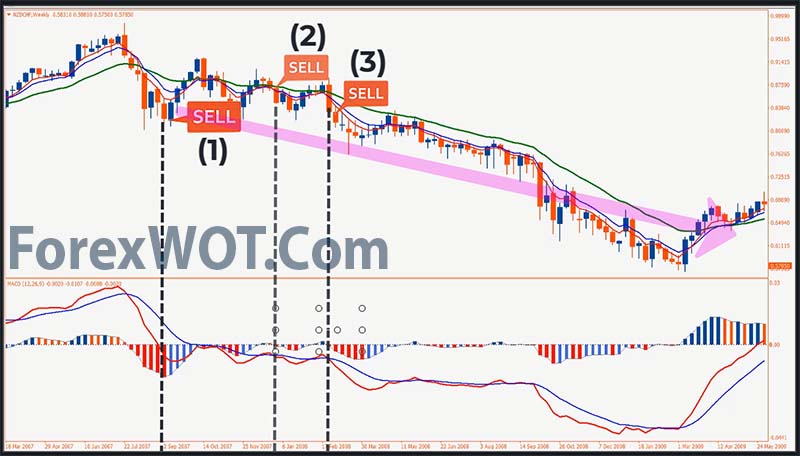
- A bearish crossover occurs between the EMA signal lines.
- The blue signal line crosses below the red signal line, and both lines are heading toward the downside in the MACD indicator window.
- MACD histogram bars appear below the middle line of the MACD window.
no strategy gives a 100% profitability guarantee at all times. We suggest following money and trade management rules when trading with these strategies besides practicing these at demo trading before applying them on actual trading.
 Top 10 BEST Forex Trading Strategy and Indicators
 The Best Way to Learn Forex Trading
 20 Halloween Costumes From Amazon All Traders will Actually Want To Wear
 The Best Forex Binary Options Parabolic Sar Strategy with TDI and Escalda Trend Signal Indicator
 Forex Parabolic SAR Trading Strategy with Day Week Month Range Indicator
 2 MACD Effortless Forex & Stocks Swing Trading Strategy
 Forex Daily Time Frame Trading with Advanced Parabolic Trend Following System and Strategy
 Forex High Profits High Accuracy Parabolic SAR System with Simple Moving Average and ATR Ratio (SAR)
 Trade Without RISK – Test Your ForexWOT Trading Systems NOW…!!!
 Foreign Exchange Trading : Online Forex Master Level Trading System and Strategy
