There is no one single super smart Forex trading tool which gives you profit, profit and more profit.
The only possible solution is to use a combination of different tools –System identifies the favorable market forces to get a maximum number of high probability trades over a period of time.
With many years of research using this system, we have now brought the ForexRacer to a new level of excellence.
There is a notion, which believes that market is based on logic.
Some believers are Gann, Elliot and the followers of Fibonacci.
The majority of losers actually believed that they could predict the future …
However, if everybody knew everything, prices would never have been a surprise and markets would be non-existent.
Don’t get into guessing.The majority of losers actually believed that they could predict the future.
This system is designed to make trading easier for the average person and professional trader, and see a real market picture to help you to be a Super Successful Forex Trader.
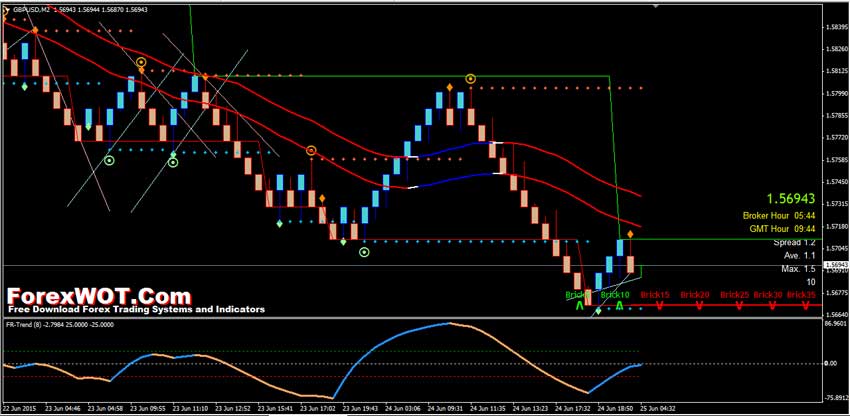
Renko charts are based on PRICE, not on TIME.
Renko charts update dynamically tick by tick.
Renko charting is considered to be best in predicting the change in the market sentiment that precedes a new trend.
Trend reversals are signaled by the emergence of a different color candle
An easy system to follow is to trade in the direction of the trend, and exit when it reverses. Support and resistance levels are easily seen on Renko charts.
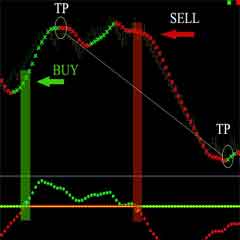
Renko charts smooth out market noise, clearly show the trend, and detect reversals. Renko charts are very effective for traders to identify key support and resistance levels. Buy/sell signals are generated when the direction of the trend & color of the candles changes.
Actual volume values are displayed for each Renko candle. What Renko charts can show even without any indicators (summary)
- Trends
- Reversals
- Support and resistance levels
- Buy/sell/exit signals
- Actual volume
- Not trusting your system or indicator(s).
- Entering a trade too late or too early.
- Taking two thirds of a trade instead of the whole lot.
- Exiting a trade too soon.
- Ignoring your self-established rules or the rules of the strategy.
- Changing rules during trading.
- Lacking patience.
- Taking trades between sessions.
- Overtrading.
- Traders are not looking at the market as is, but through the lenses of their own expectations.
- Risk Level.
- Traders do not follow their own rules like StopLoss, TakeProfit and get out from winning position too early.
You must know your strategy before you start trading. If market turns against you get out of trade when stoploss conditions have been met.
Always follow your trading plan. Not following the trading plan is the number one mistake traders make.
You must know exactly what you are going to do from start to finish BEFORE you enter a trade, and stick with it. Don’t second guess yourself in the middle of a trade. If you can’t overcome this hurdle you won’t be around as a trader for long.
Never hesitate to enter a trade when you have set up conditions.
Be careful with reversals; do not get in too early.
Patience is the key.
Many people starting out in trading have difficulty with the principles of Money and Risk Management.
In this aspect of trading you have to calculate everything for you and adjust the size of your trades based on the balance of your account whilst respecting your tolerance for risk.
Let us also assume that you are prepared to risk 5% of your account on each trade.
$1,000 x 5% = $50 risk capital.
Since buy and sell transactions are not cleared by a central system, there is no way of knowing the total volume of a trade. Lack of volume data can pose a challenge to stocks or futures traders who have made the switch to currencies as they may have become used to checking volume.
Renko System gets a lot of resources from your computer that’s why we recommend use clean MT terminal.
Before installation of ForexRacer System you must install Renko charts and
it’s important to make sure that your history data is complete and accurate.
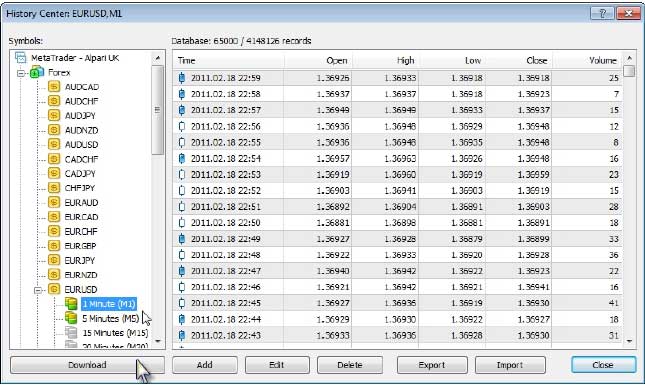
Download History data only for currencies you will work with. (1 min charts).
Open Metatrader
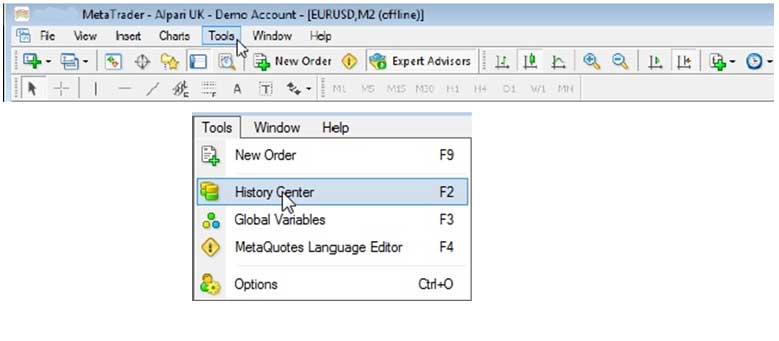
The next thing to do is go to the
Tools – History Center
Find pairs you will work with and download it (1 Minute).
We strongly recommend using a 5 digit broker.
In this case tick size on Renko will be $0.10.
If you use 4 digits broker tick size on Renko will be $1.00.
You can see tick size on your Scanner
We advise to get history data from Alpari broker.
You can use Alpari History data to any metatrader broker. Just replace data to Alpari history data.
Example:

Go to My computer-System (C)-Program Files-(your MetaTrader Broker)-history-downloads and replace History files.
Expert Advisor
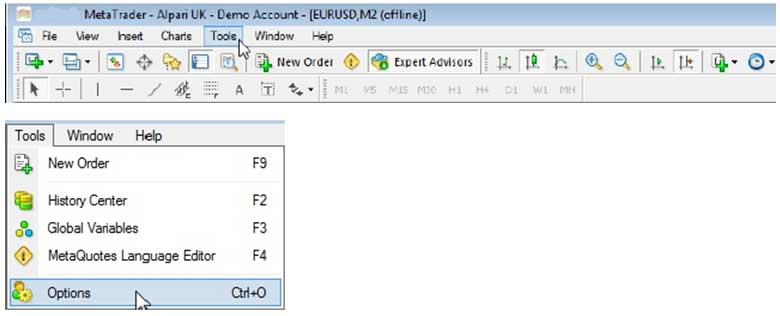
Open Metatrder
The next thing to do is go to the
Tools – Options –Expert Advisors
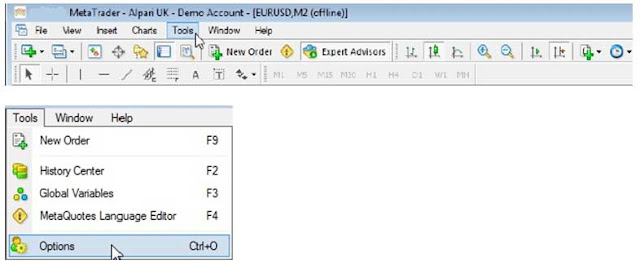
and ensure that the highlighted options are set exactly as shown below:
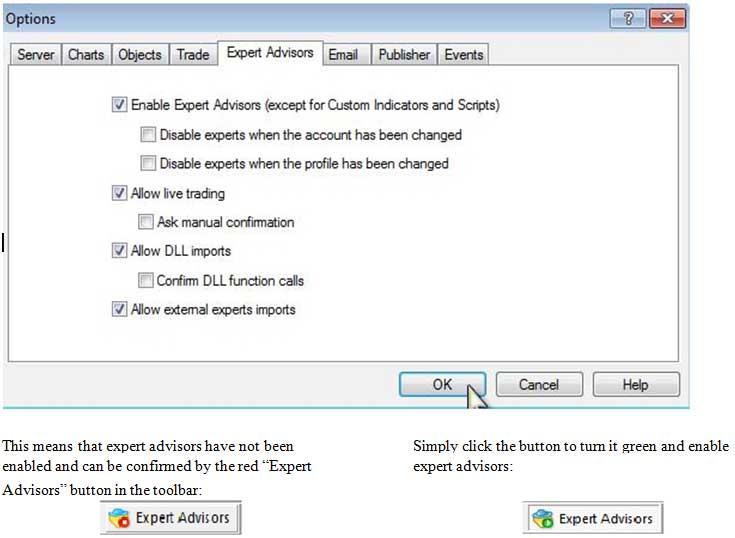
Either press the “F7” key or click the sad face to open the EA properties dialog window again, then confirm that the “Allow live trading” setting is checked before clicking the “OK” button.
Charts
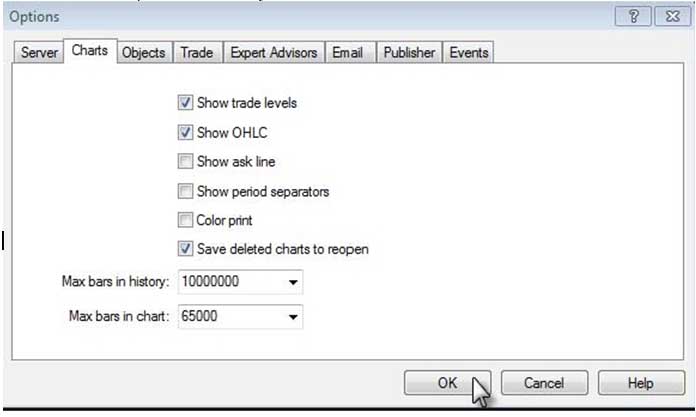
The next thing to do is go to the Tools – Options – Charts
And ensure that the options are set exactly as shown below:
1 – Open Metatrader.
2 – Open 1min chart.
3 – Place RenkoExperetAdvisor or RenkoScript on this chart.
This message will appear after you place EA.

DO NOT CLOSE 1 MIN CHART with EA you can just drop it down.
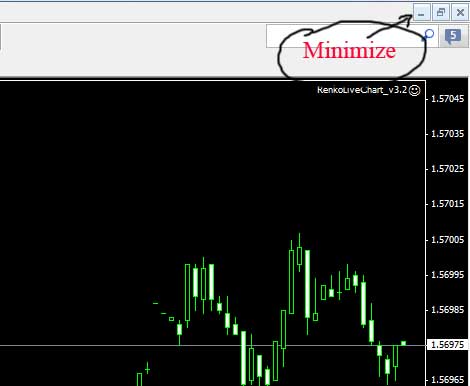
In order to import more 1 minute bars you can do the following:
Press and hold ‘Home’ key on desired 1 min chart until the chart stops scrolling.
4 – Open offline 2Min chart.
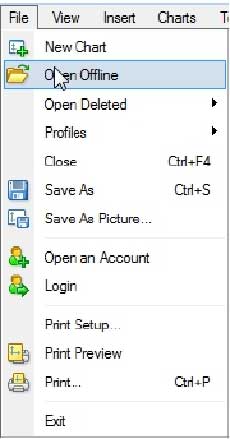
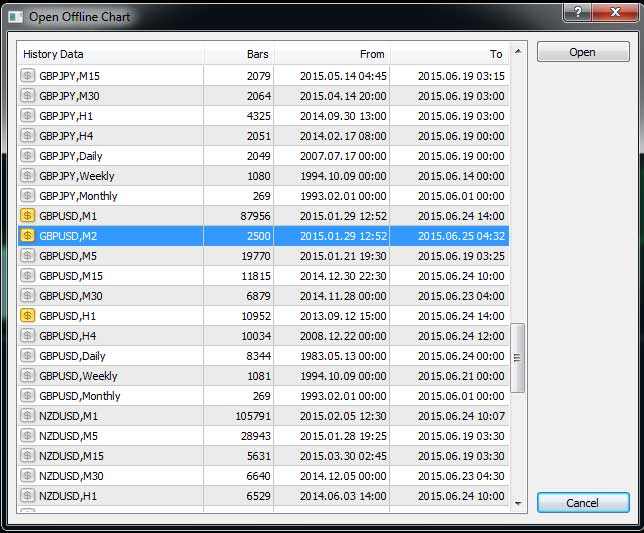
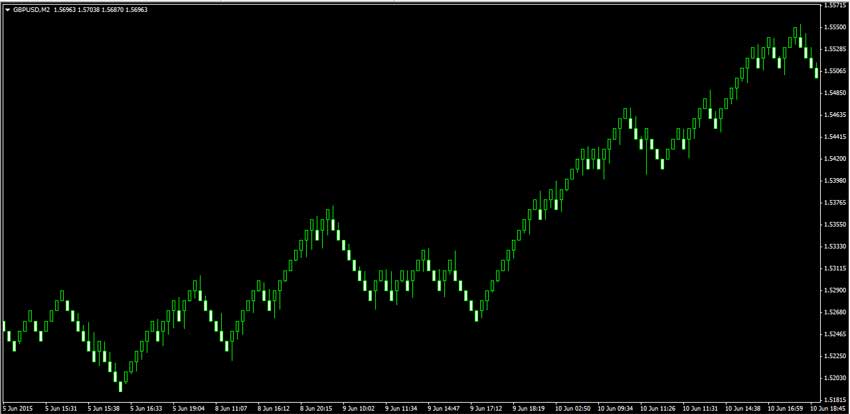
Now your chart look like this:
Insert template onto this chart.
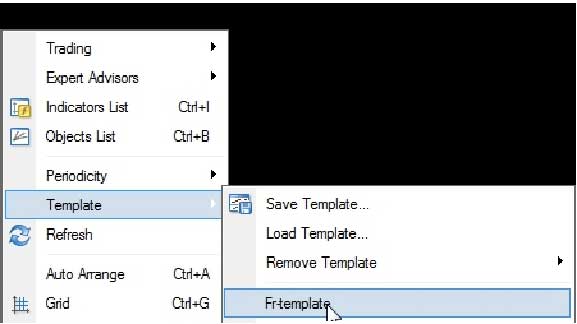
Forex Renko System is ready.
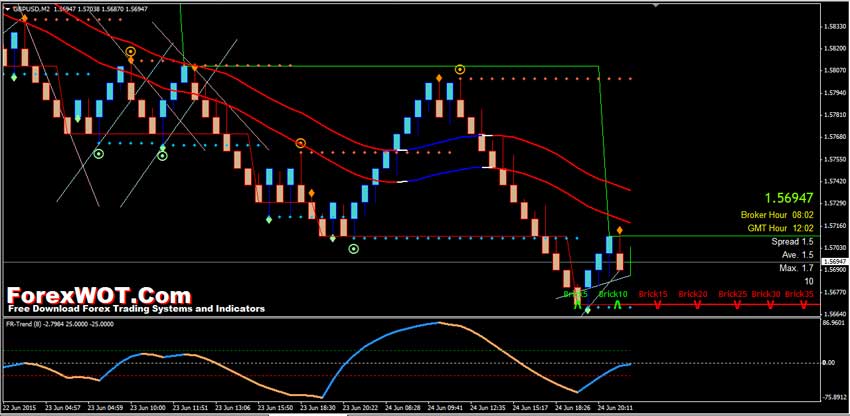
Renko charts are very effective for traders to identify key support and resistance levels. Buy/sell signals are generated when the direction of the trend & color of the candles changes.
A trendline is a dynamic line of support during an uptrend and a dynamic line of
resistance during a downtrend.
It is easy to find trendlines with Renko Charts.
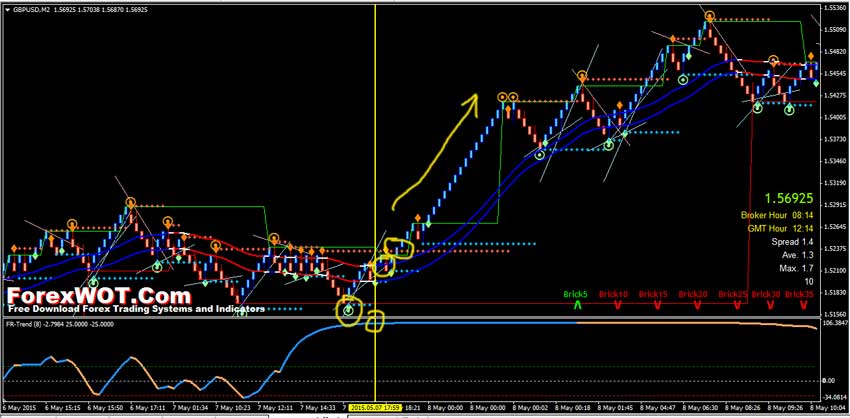
The most important thing in trading – recognize sideway (flat) market.
In SideWays market conditions you have 2 possibilities – Wait or Change currency.
1. FR-TrendLines indicator has no angle, changing his color and goes thru bricks (candles).

2. FR-Signal and FR-ReversalPoints indicators generate too many signals which stand pretty close to each other.
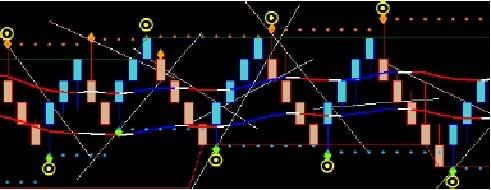
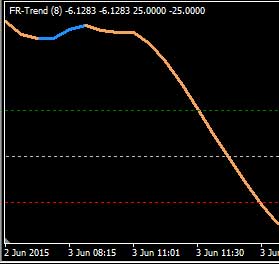
3. FR-Trend indicator keep changing his color and almost doesn’t have an angle.

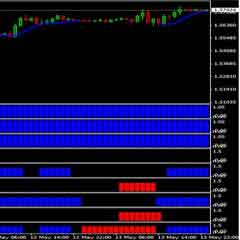
4. FR-Scanner bricks keep changing color (directions).

How we recognize the end of sideway market?
We follow Forex Renko Racer enter rules.
1 FR-Trend indicator show uptrend color
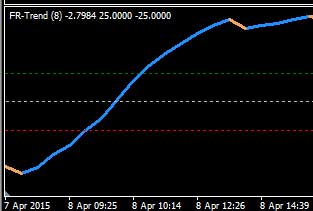
2. FR-Lines indicator show uptrend color
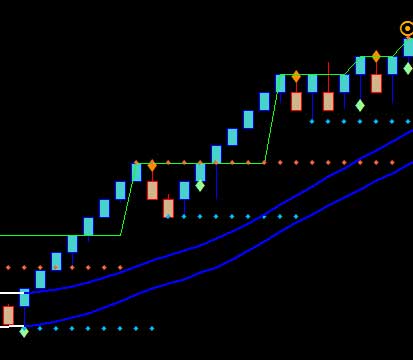
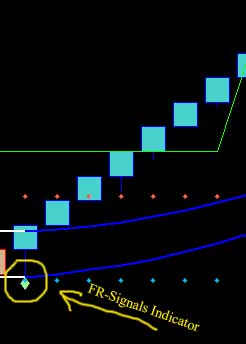
3. FR-Signals Indicator show uptrend color
4. FR-Scanner bricks show uptrend color (direction)

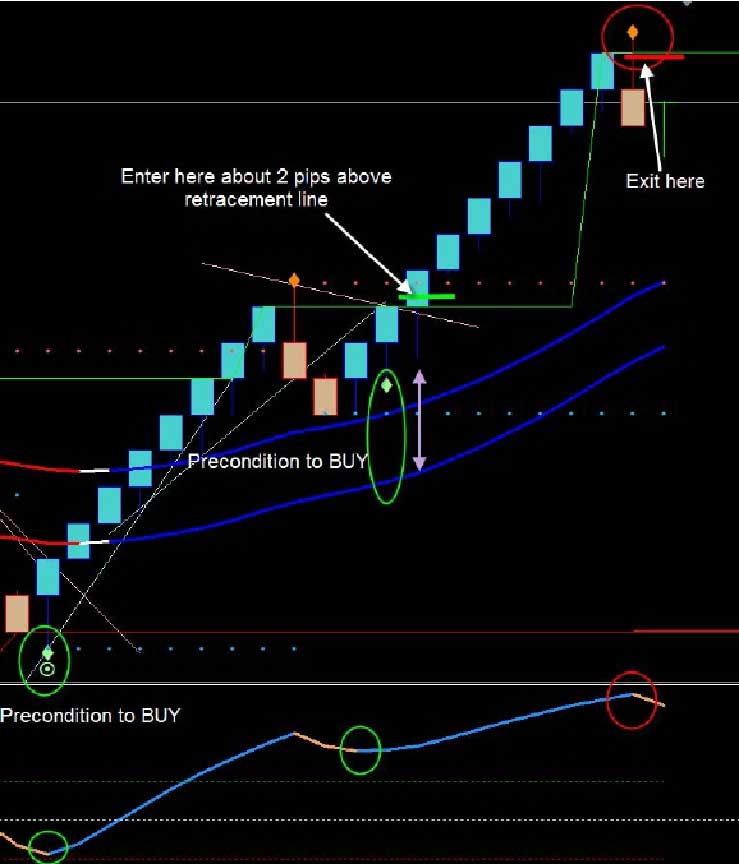
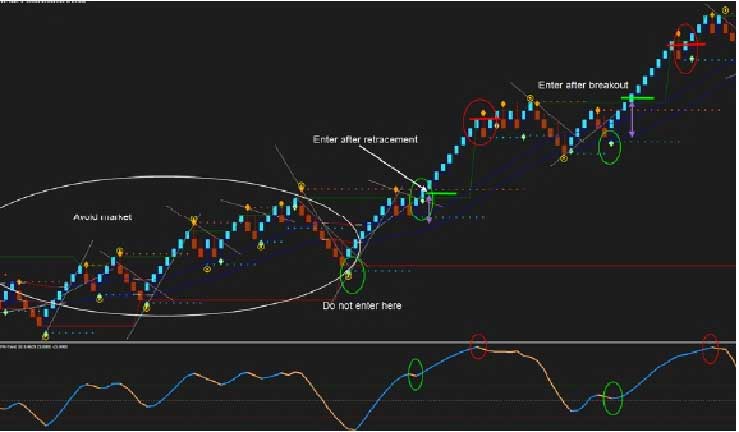
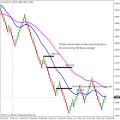
5. Enter trade after retracement or breakout line (1-2 pips above). See picture.
1 FR-Trend indicator show downtrend color
2. . FR-Lines indicator show downtrend color
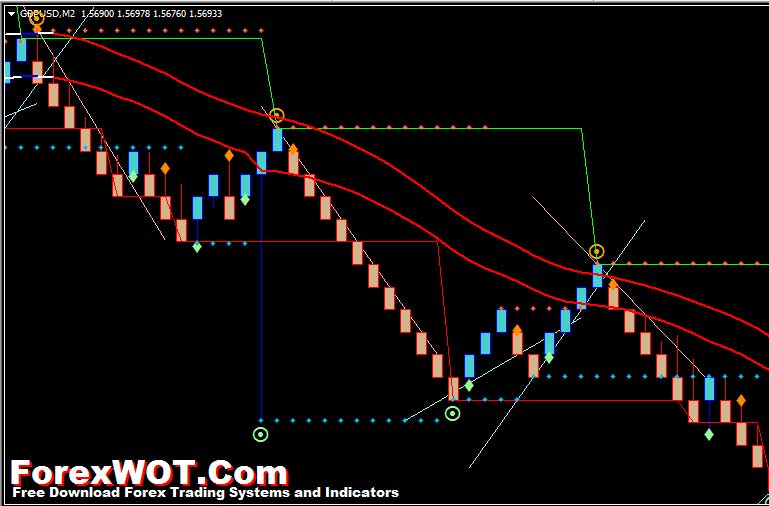
3. FR-Signals Indicator show downtrend color
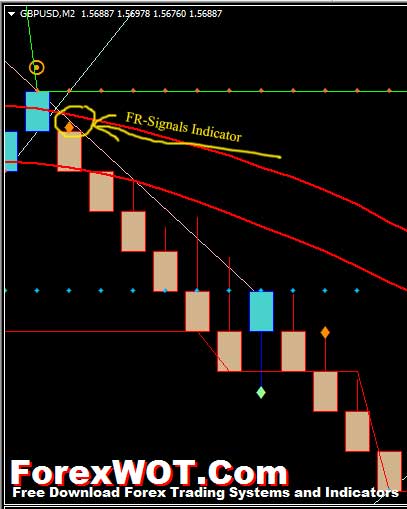
4. FR-Scanner bricks show downtrend color (direction)

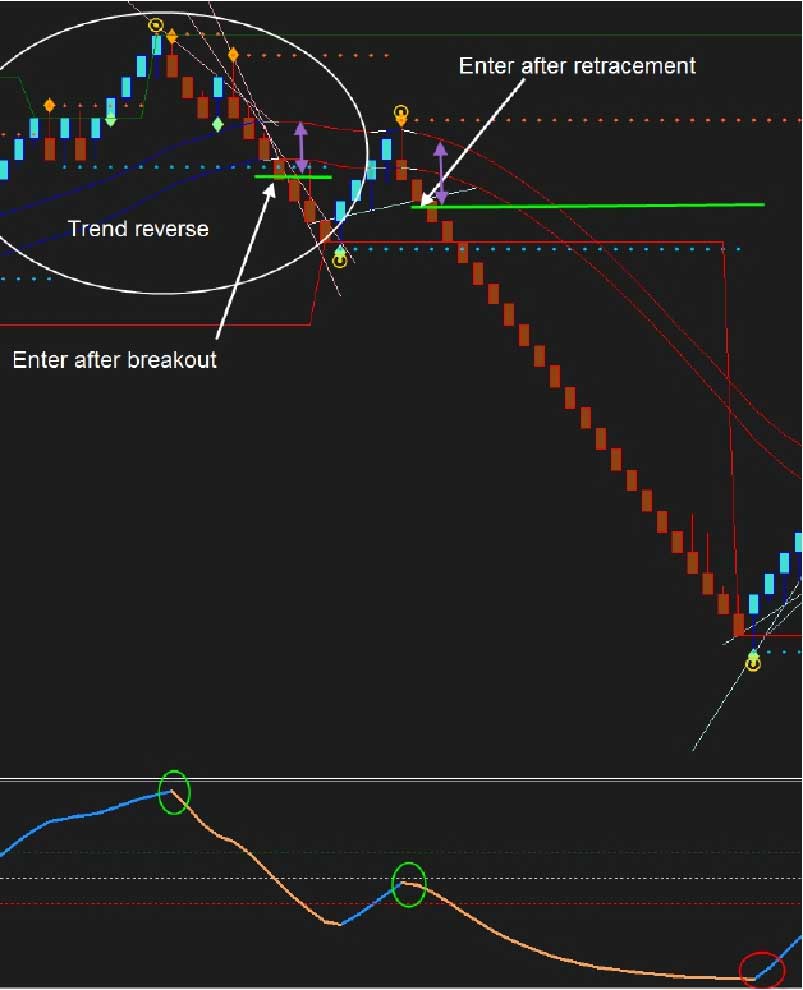
5. Enter trade after retracement or breakout line (2 pips below). See Examples.
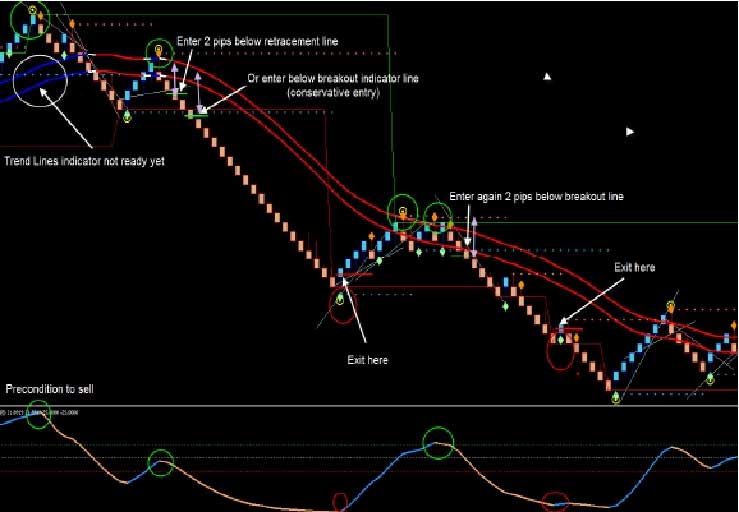
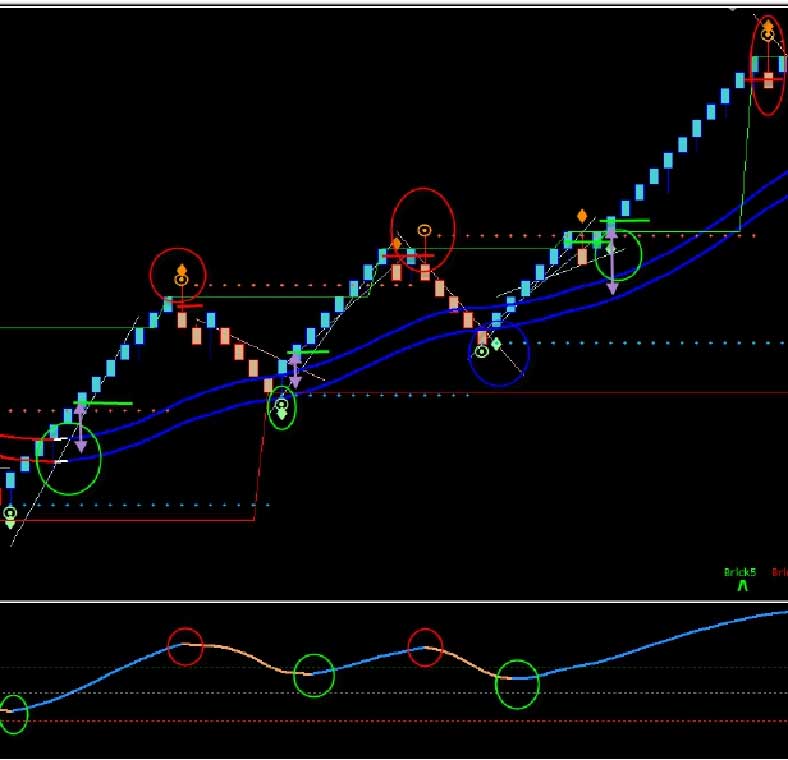
Retracement examples:

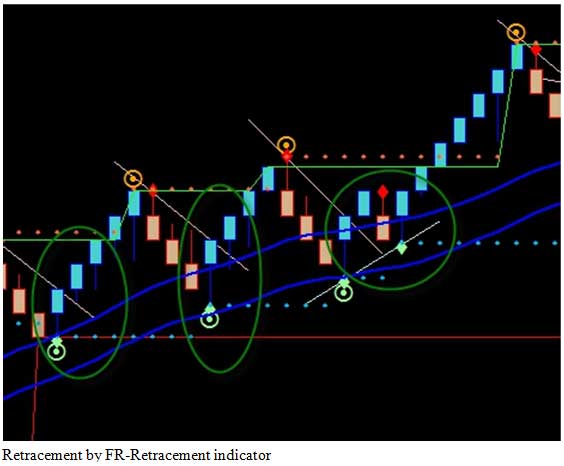
Always enter the trade 1-2 pips bellow/above retracement or breakout line.
Study trade examples bellow for all rules.
- FR-Trend indicator change color.
- Brick (candle) change color.
Never work without StopLoss.
By default use approximately 50 pips and then calculate StopLoss more precisely.
- 95% of time those currencies goes on same direction and predict each other.
- About 70% of time London and NY sessions change trend direction – be careful.
- Exit and enter points not only indicators set up matter but also time matter.
- For Intraday trading we recommend brick size 10 (default).
- For Positional trading change brick size to 30 (in your EA inputs).
- If you trade EUR/USD or GBP/USD always keep open 2 charts.(EUR/USD, GBP/USD)
- Trade the pair on which you see more clear picture.
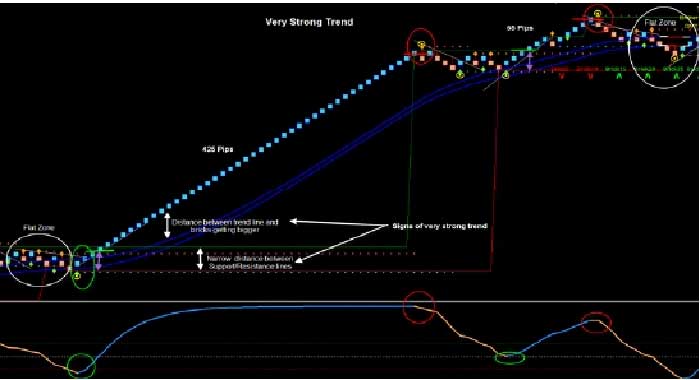
Signs of strong trend
Forex Racer team with those who attempt guessing and try to get a non-existent undisclosed trend cipher. Even thoughForex expense trends seem disordered, basing your business on cost fluctuations will make you a winner.
It may not be an ideal business for many; however, if done correctly, you can make a large amount of money through Forex
trading.
[signinlocker]
[/signinlocker]






Hi. I’m a little confused: what is the point of having the coloured bars on an off-line chart other than back-testing?
Is it therefore necessary to continually update the off-line chart through the process described above? How then would one trade different currencies concurrently.
Please excuse my ignorance if this is a stupid question.
hi
please sent me best forex renko total sestem and indicatoirs
thankes
hi a didnt knew how to set up the chart and download the 1m from alpari help please
Hello. the chart wont load. And it has a little sad smiley? : (