I have developed a new Auto Trend Line Strategy that simple and yet easy to understand.
The first thing you need to do is identify an upward, downward, or sideways trend by switching to a daily and 1 hour time frames.
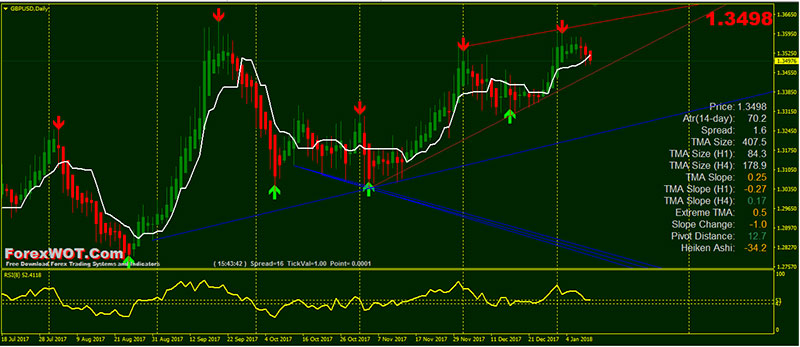
The reason both are used is that it will give you the best perspective in determining a long-term and short-term trend according to this strategy.
In this trading system article, I will show you how to trade Auto Trend-Line indicator correctly.
Daily (D1) is the best time frame to help you determine a long term-trend.
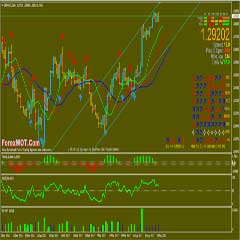
This system automatically draw channels and trend lines to help you identify the direction of a trend and they can also help you understand range markets much better.
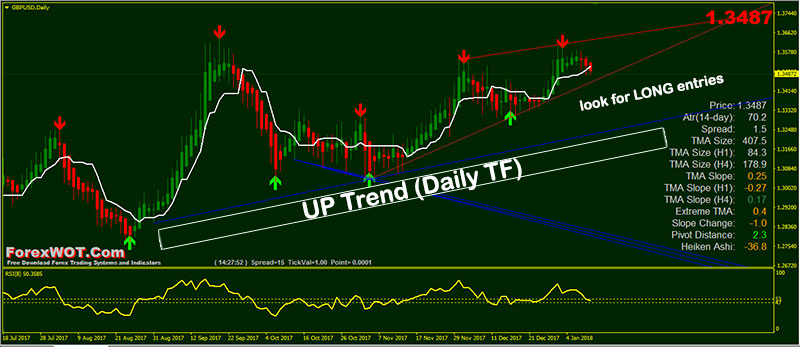
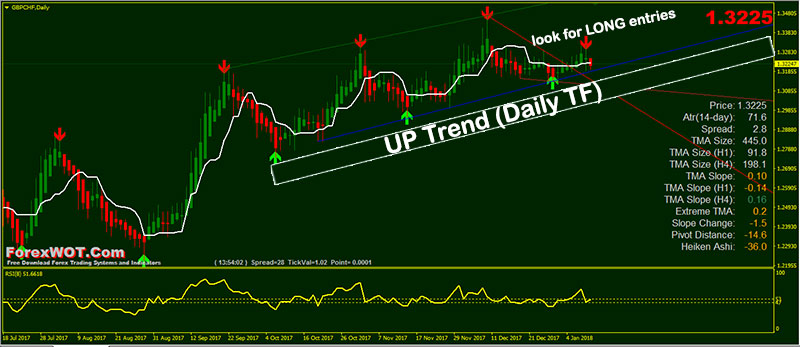
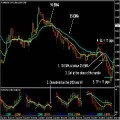
Take a look at the image below (follow the BLUE lines)
GBPUSD D1 TF (long-term up trending)
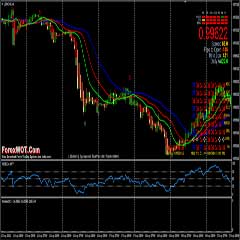
GBPCHF D1 TF (long-term up trending)
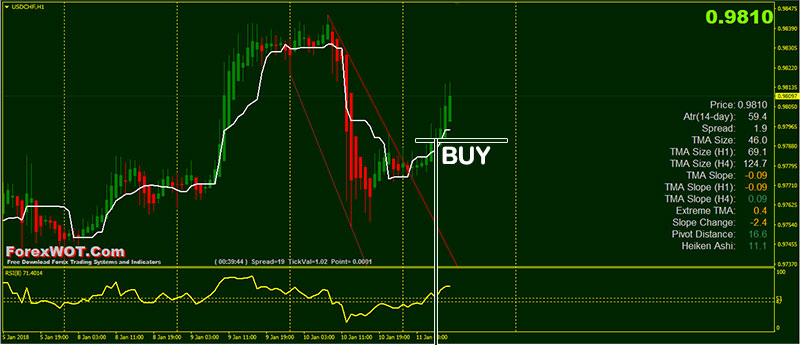
- Price upward and has closed above the resistance line
- Trend Candles green color and has closed above the Tenkan-Sen line
- RSI line upward above the 53 level
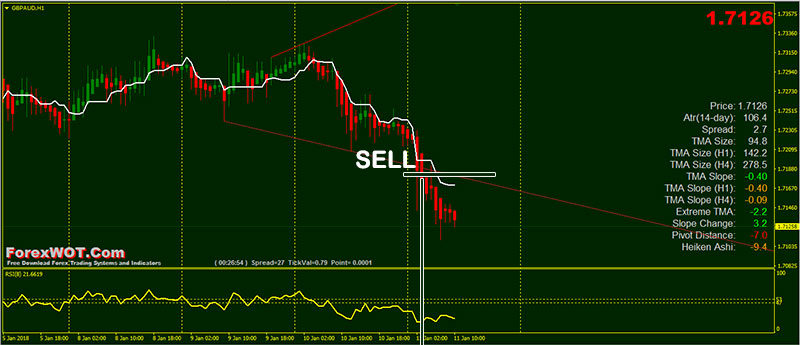
- Price downward and has closed below the support line
- Trend Candles red color and has closed below the Tenkan-Sen line
- RSI line down below the 47 level
- Always wait for the current candle to close beyond the trendline to confirm the break.
- Set your Stop a few pips beyond the trendline and set your Limit at least twice as far as your Stop.



I can’t download it. Can you send it to my mailbox? Websina@qq.com