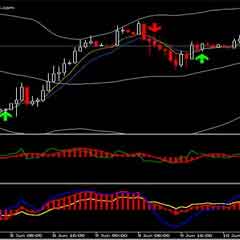
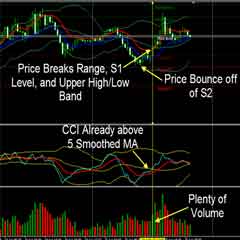
I will show you A GREAT TRADING PATTERN that will allow you to profit from trading ranges by using only one tool the Bollinger Bands.
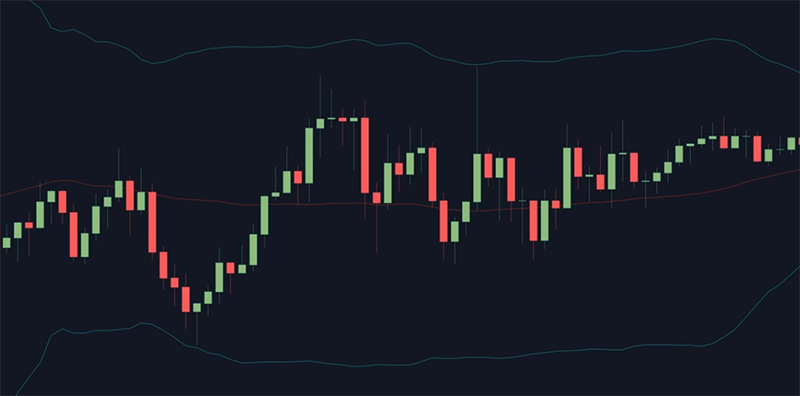
This trading pattern involves searching for periods of low volatility with the Bollinger Bands parallel one to each other.
The key of this pattern is that we won’t use the standard settings of the Bollinger Bands, and we will use 50 period moving average and the standard deviation of three, because almost 99% of the price action is contained within the standard deviation of three of the Bollinger Bands
Now I don’t know about you, but I prefer to trade with the odds in my favor so if a standard deviation of three will offer me around a 99% certainty that the price won’t exit the Bollinger Bands then I will be interested to trade only with these settings.
The pattern is simple we will use the upper and the lower Bollinger Bands as dynamic support and sistance levels only when the Bollinger Bands are parallel one to each other.
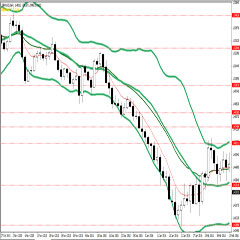
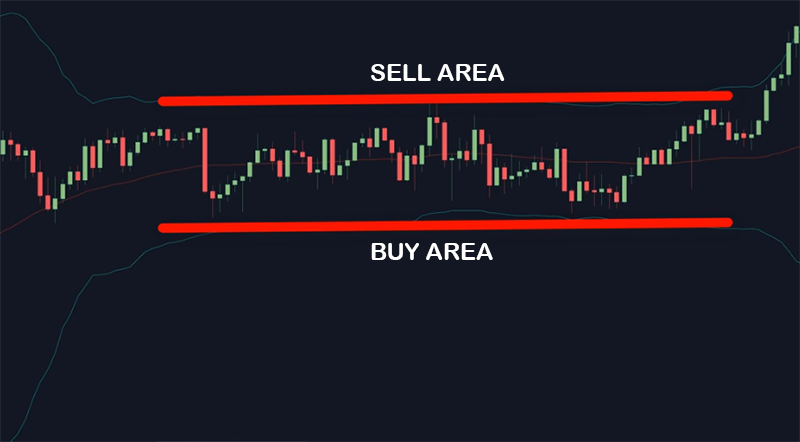
Here is the pattern you need to search for on your charts.
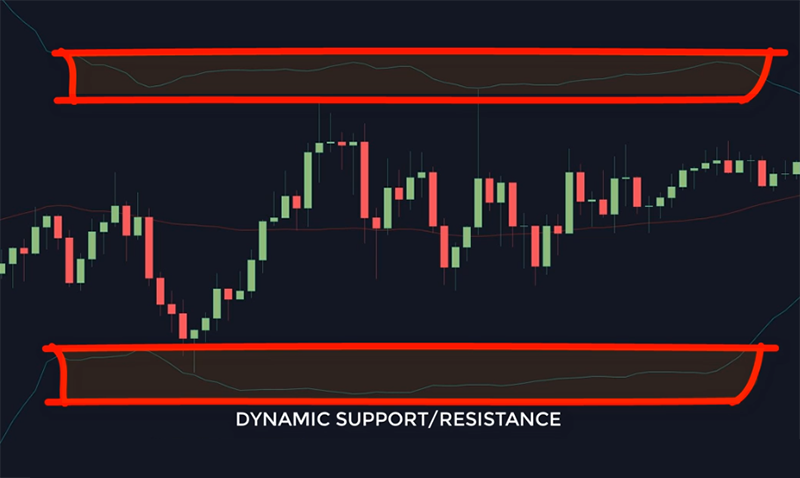
The Bollinger Bands serve as a pretty accurate dynamic support and resistance indicator and the price barely exceeded the band’s.
The key of this pattern is the parallel Bollinger Bands.
We want to see the bands narrow and parallel.
If this area coincides with a previous swing of support and resistance that’s even better. The pattern will be stronger.
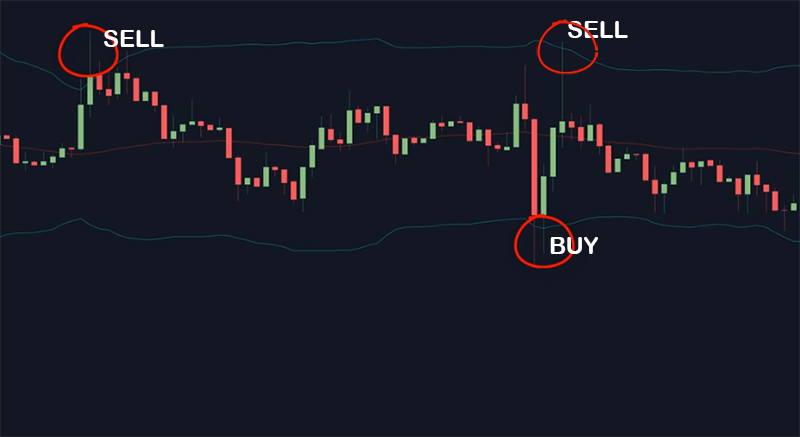
In this example we have a perfect BUY at a lower Bollinger Band an area also supported by the previous swing low.
We also see a great SELL entry at the upper Bollinger Band right at the previous swing higher.
Here is the same pattern on the EUR-JPY. Once we see the Bollinger Bands parallel one to each other we have our range and we start looking for entries at a lower and the upper Bollinger Bands.
As this pattern involves a lower volatility, you just BUY when the EUR-JPY tests the low end of its range, and you SELL when the currency pair tests the high of the range and the upper Bollinger Band.
This pattern won’t allow you to catch big movements but at least you will trade a high probability setup when all the conditions are met.
- The first target should be the middle band;
- and the next one will be the opposite end of the Bollinger Bands.
Depending on the timeframe traded or the size of the training range you have room to catch some decent points with diminished risk.
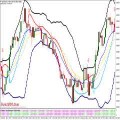
Here’s the Dow Jones index with the same pattern.
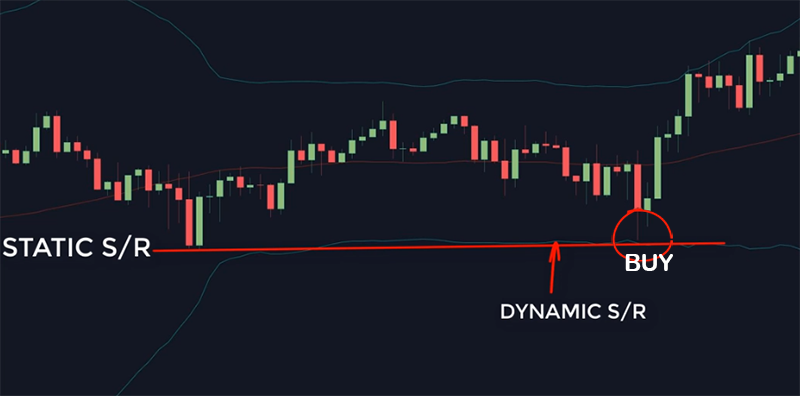
Here we have a perfect BUY a the lower band. Observe how the price stopped right at the previous support level which formed an area of confluence with a lower Bollinger Band.
in this example we have a static support and resistance and the dynamic one. A very powerful pattern.
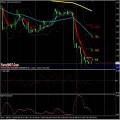
Very important, we need to always check the bands to see if they are still parallel.
Once we see the indicator expanding, that’s a sign of increasing volatility and we should exit the trade if we have a contrarian position opened.
In this example we decided to short the market at the upper Bollinger Band and once we saw the bands expanding we close the position manually for a small loss.
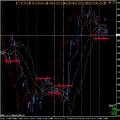
Here’s another example on the decks index chart.
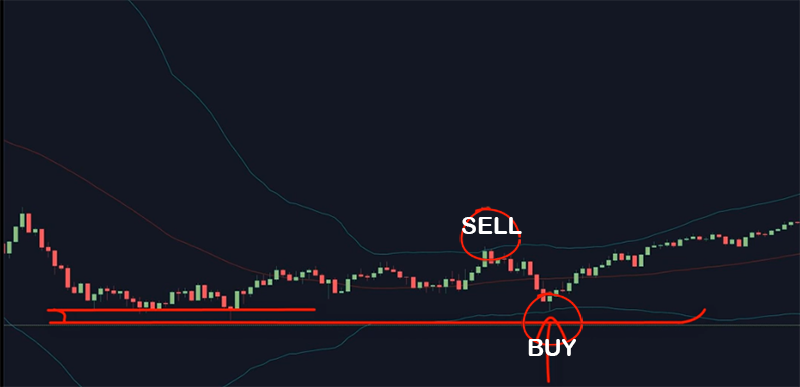
Here we have a great SELL entry at the upper Bollinger Band followed by an excellent BUY entry at a lower band area which also included a support level from the previous price action.
This is one of my favorite Bollinger Bands patterns as it allows me to enter the market during low volatility periods at high probability areas and more importantly with tight stop losses outside the Bands.
You could argue that you don’t need the Bollinger Bands to execute this strategy, but by having the Bands you can validate that the market is in a flat or low volatility phase by reviewing if the Bands are parallel one to each other.


