FREE DOWNLOAD MACD-RSI Price Action Trading System – Best High Accuray Candlestick Patterns “Price Action” Trading System and Strategy. This is Candlestick Patterns Trading System Every Trader Should Know Every Trader Should Know.
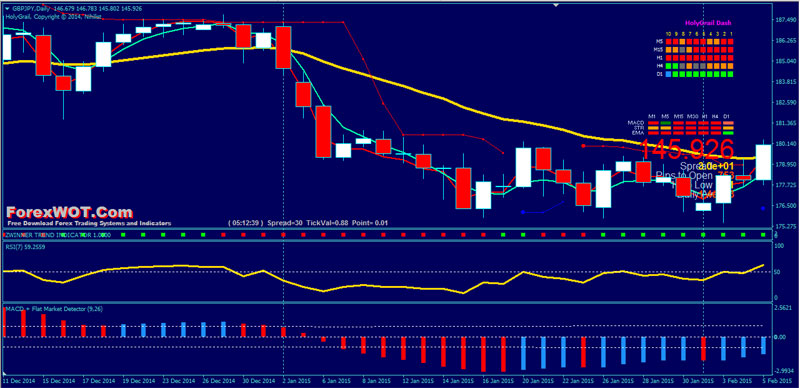
Are you using candlestick charts as your default chart type for price action analysis?…
Most likely, the answer is yes. In that case, why not make the most out of it by mastering candlestick patterns?
However, you should familiarise yourself with one, two, or pattern.
Trying to look out for dozens of patterns without knowing what they are trying to tell you lands you in a confusing mess.
ForexWOT MACD-RSI Price Action Trading Rules
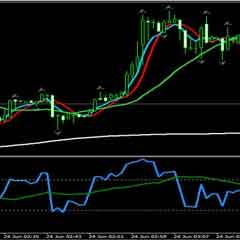
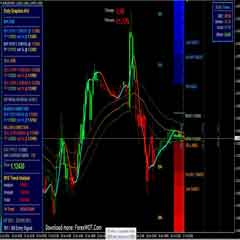
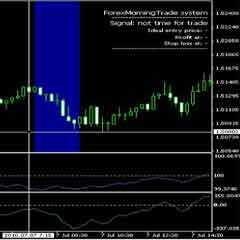
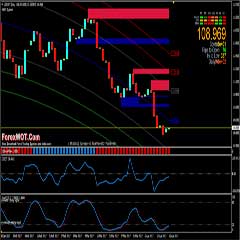
ForexWOT MACD-RSI Price Action Trading System is based on Candle pattern and high accuracy trend filter indicators.
- Best Time Frame : 1H, 4 H or Daily (D1). Works good At the Daily TimeFrame.
- Recommended Pairs : GBPUSD, USDJPY and AUDUSD
Metatrader Trading Indicators
- Exponential Moving Average
- NIHILIST HolyGrail Dash
- BBands Stop
- Signal Trend
- MACD
- RSI
General Rule : Trade only in the direction of the trend
Best Candle Pattern : Englufing and Pinocchio Bar
Engulfing Candlestick Patterns
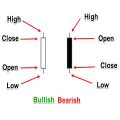
The engulfing candlestick patterns, bullish or bearish are one of the easiest of candlestick reversal patterns to identify.

Because these candlestick patterns are two-candlestick patterns, they are more valid and are often looked upon as reversal patterns.
As with any candlestick pattern, the bullish or bearish engulfing pattern takes more priority depending on the time frame that they are formed on.
Therefore, when looking to trade with the engulfing candlestick pattern, it is essential to first scan the charts from monthly, weekly and daily and then to the lower time frames.
Pinnocchio Bars Pattern
Pinnocchio Bars or Pin Bars are one of the most popular of price action candlestick pattern. They show a clear rejection of a price level and are often followed by a large directional move opposite the direction of the rejection.
A Pin Bar is an individual candlestick pattern and is identified by its long wick and small bodies.
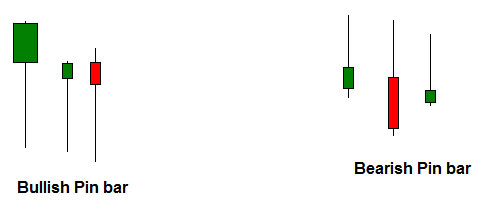
Typically, the wicks of the Pin Bar should be longer than the body.
The chart below shows some different variations of the Pin Bar candlestick patterns.
BUY Rules
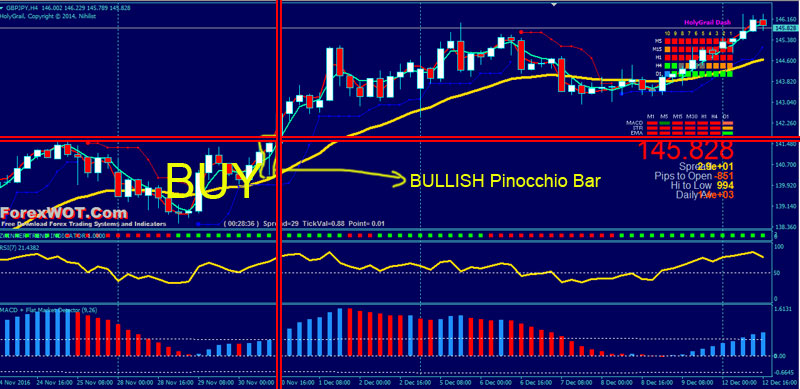
- BULLISH Englufing or Pinocchio Bar Price Action candlepattern
- NMA > MA (4) > EMA 24
- MACD Flat Market Detector blue bars above 0 level
- Trend filter Green bar
- Signal Trend green bars
- Holy Grail Dash green
SELL Rules
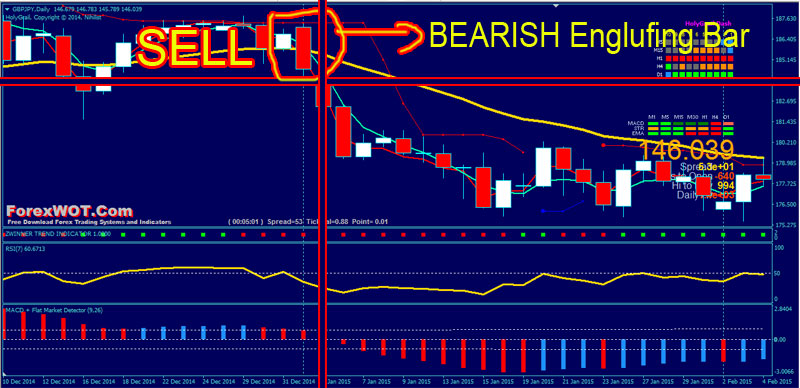
- BEARISH Englufing or Pinocchio Bar Price Action candlepattern
- NMA < MA (4) < EMA 24
- MACD Flat Market Detector red bars below 0 level
- Trend filter red bar
- Signal Trend red bars
- Holy Grail Dash red
EXIT Rules
- Exit position when trend filter change colour or when NMA crosses MA in opposite direction
- Initial stop loss on the previous swing


