Forex Most Provitable Trend Trading System. How to Make 600 Pips a Month Consistently – Components of the System
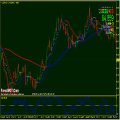
- Guppy Multiple Moving Average (GMMA) Slow Group (orange color in my illustrated charts)
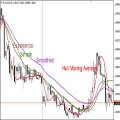
- Exponential Moving Average (EMA): EMA 20 (magenta) and EMA 30 (magenta)
- Hull Moving Average (HMA): HMA 5 (blue when pointing up, pink when pointing down) and HMA 12 (green when pointing up, purple when pointing down)
- Moving Average Convergence Divergence (MACD):
MACD (30,60,30) – we call it long MACD
The trend is regarded as up when long MACD has crossed up and both EMA 20 and EMA 30 are pointing upward and the spread between EMA 20 and EMA 30 is considerably large (the two EMAs are well separated from each other).

The trend is regarded as down when long MACD has crossed down and both EMA 20 and EMA 30 are pointing downward and the spread between EMA 20 and EMA 30 is considerably large (the two EMAs are well separated from each other).

Why is it required that EMA 20 and EMA 30 are well separated from each other …? Because if they are close together, the market is probably choppy and therefore whipsaws are likely to occur.
We have two types of entry signals, namely Level 1 (L1) signal and Level 2 (L2) signal. They are described as follows:
Buy (Go Long): When price is trending up (as defined by our above criteria), we look for a small stall or retracement, and then enter whenthe trend resumes. Price retraces and makes HMA 5 changes its direction from up to down.
We enter when HMA 5 changes its direction from down to up. It signals that the price has resumed its established trend.
During the entire retracement, however, HMA 12 direction is still up (i.e. price only retraces a little bit, not enough for HMA 12 slope to change). This is what distinguishes L1 signal from L2 signal.

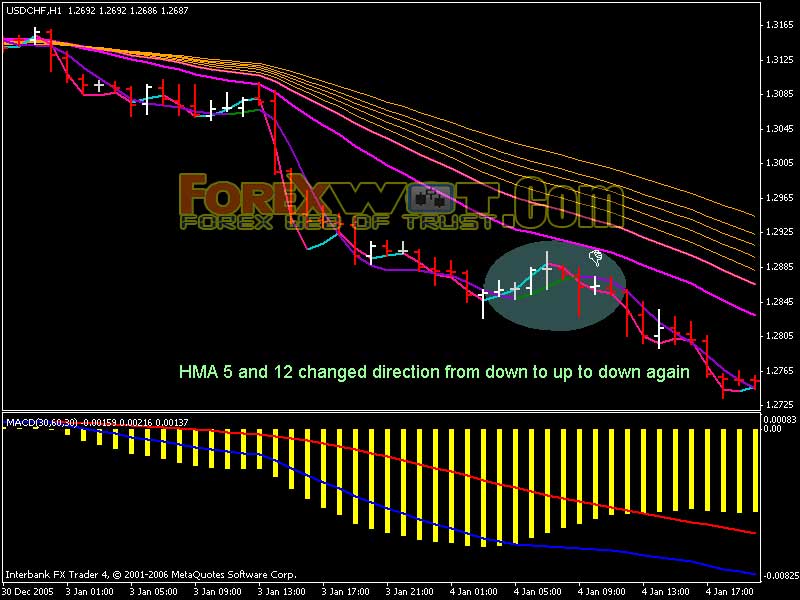
Sell (Go Short): When price is trending down (as defined by our above criteria), we look for a small stall or retracement, and then enter when the trend resumes. Price retraces and makes HMA 5 changes its direction from down to up.
We enter when HMA 5 changes its direction from up to down again. It signals that the price has resumed its established trend.
During the entire retracement, however, HMA 12 direction is still down (i.e. price only retraces a little bit, not enough for HMA 12 slope to change). This is what distinguishes L1 signal from L2 signal.

Buy (Go Long): When price is trending up (as defined by our above criteria), we look for a larger retracement than in L1 signal, and then enter when the trend resumes. Price retraces and makes both HMA 5 and HMA 12 changes their direction from up to down.
We enter when both HMA 5 and HMA 12 changes their direction from down to up. It signals that the price has resumed its established trend.

Sell (Go Short): When price is trending down (as defined by our above criteria), we look for a larger retracement than in L1 signal, and then enter when the trend resumes.
Price retraces and makes both HMA 5 and HMA 12 changes their direction from down to up. We enter when both HMA 5 and HMA 12 changes their direction from up to down. It signals that the price has resumed its established trend.
With each signal, we enter with three lots.
Stop loss is placed as the last swing high/low If the trade goes in our favor, we exit 1 lot at the same distance as the stop loss.
For example, if our stop loss is place at -40 pips from the entry price, we exit the first lot when we have +40 pips (excluding spread) in profit. As soon as we take the first lot out, we move our stop loss to break-even for the remaining two lots.
The second lot is taken out when HMA 5 changes its direction against us (that means in an uptrend we exit the second lot when HMA 5 turns down).
The third lot is taken out when HMA 12 changes its direction against us (that means in an uptrend we exit the third lot when HMA 12 turns down).
If the trade does not go in our favor, we exit all three lots when HMA 12 changes its direction against us (that means in an uptrend we exit all three lots when HMA 12 turns down) or when our stop loss is hit.

We do not take trades when price has retraced too much and when the trend has lost its momentum. When one of the following conditions takes place, we do not put on any trade until a new trend has established:
- Price closes below GMMA in an uptrend or closes above GMMA in
- A downtrend.
- Long MACD crosses down in an uptrend or crosses up in a downtrend.


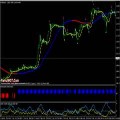
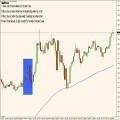
The first thing we need to identify is the current trend. Long MACD crossed up, signifying an uptrend.

Then we look for a small retracement of price. In the above picture, price retraced a little bit (two red candles), making HMA5 turn down.

The next bar, price resumed its upward direction, making HMA5 turn up again. We had a L1 long signal and entered with three lots.

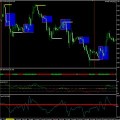
First lot was taken out when price moved the same distance as stop loss. Second lot was exited when HMA5 turned down (indicated by the blue rectangle).

Final lot was taken out as HMA12 turned down.

L1 Signal:
- We entered at 1.9039, placed stop loss at 1.9010
- First lot taken out at 1.9069
- Second lot taken out at 1.9137
- Third lot taken out at 1.9141

L2 Signal:
- We entered at 1.9178, placed stop loss at 1.9138
- First lot taken out at 1.9218
- Second lot taken out at 1.9331
- Third lot taken out at 1.9316


