High Accuracy Hull Moving Average Trading – Forex (GBPUSD & EURUSD) and Bitcoin DAILY time frame trading strategy for maximum profit potential.
This is a super simple and highly effective trading system you should know.
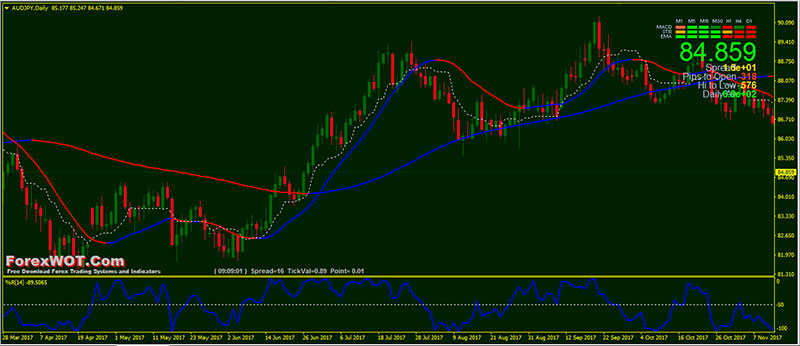
This strategy was based on the Hull Moving Average, Kijun-Sen line, and WPR indicator.
This strategy using Daily chart timeframe and recommended pair to trade were GBP/USD, EUR/USD, and Bitcoin.
This strategy was claimed has a win ratio of over 70%.
Before you go with a live account is recommended to use a demo account until you are familiar with this strategy.
The Mega Trend or Hull Moving Average (HMA), developed by Alan Hull, is an extremely fast and smooth moving average.
In fact, the HMA almost eliminates lag altogether and manages to improve smoothing at the same time.
Like any other moving average, if the HMA is rising along with price, it indicates an UPTREND. Conversely, if the HMA is falling along with price, it indicates a DOWNTREND.
Traders can take a BUY position if prices are rising and the HMA is trending upwards (Blue color HMA line). However, traders can take a SELL position, if the prevailing trend is falling (Red color HMA line).
- A longer period HMA (ex. 100 HMA) may be used to identify a trend.
If the HMA is rising, the prevailing trend is rising, indicating it may be better to enter long positions. If the HMA is falling, the prevailing trend is also falling, indicating it may be better to enter short positions.
- A shorter period HMA (ex. 21 HMA) may be used for entry signals in the direction of the prevailing trend.
A long entry signal, when the prevailing trend is rising, occurs when the HMA turns up and a short entry signal, when the prevailing trend is falling, occurs when the HMA turns down.
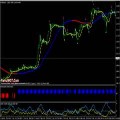
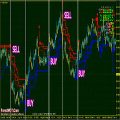
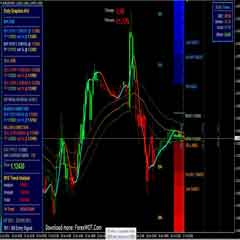
Take a look at the image below.
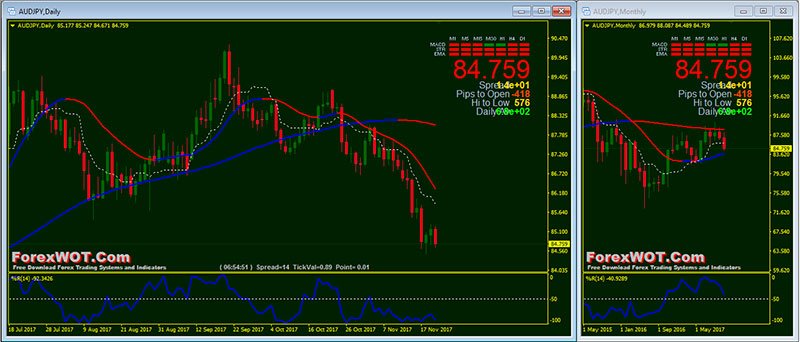
For instance, you can see that I have highlighted SELL entry signals when the red color HMA (21) crosses and below the red color HMA (100) and BUY Entry signal when blue color HMA (21) crosses and above the blue color HMA (100).
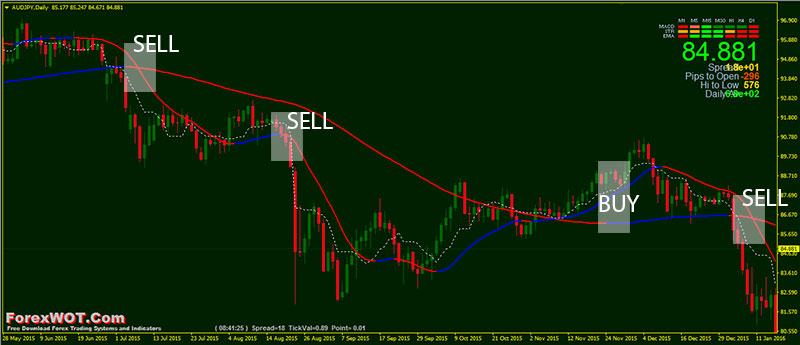
However, it shouldn’t be used to generate crossover signals. You still need to be patient and filter your trades with WPR (Williams’ Percent Range) indicator.
Williams’ Percent Range is a technical indicator of oscillator type showing overbought/oversold status on market.
The first time Williams’ Percent Range was described in 1973 by a famous trader Larry Williams.
The indicator itself is very close to Stochastic Oscillator, but unlike Stochastic, WPR is not smoothed over with the help of moving average and has a reverse sale in order to not deprive sense of overbought (at the top) and oversold (downwards) zones.
In this trading system, I am going to talk about the -50 level that sits between the -20 and -80 levels.
Williams’ Percent Range (WPR) -50 level can be used as a strong tool to confirm the different kinds of trade setups from any trading system.
Whether you use the candlestick patterns, support/resistance breakout, or any other trading system, you can consult the WPR -50 level to confirm your trade setups.
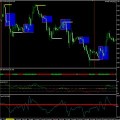
Let me show you some examples.
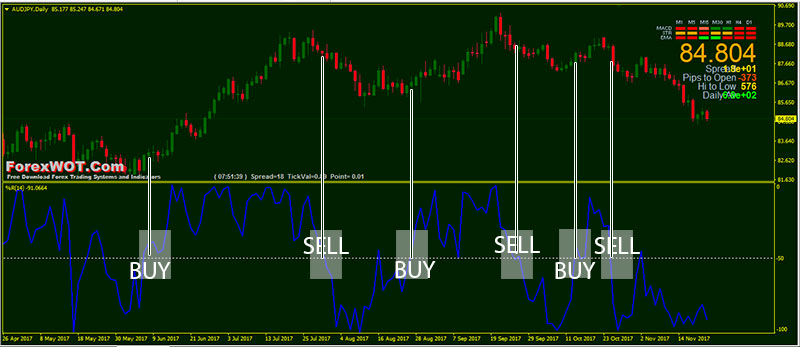
This is how the WPR -50 level helps us confirm our trade setups.
This system is incredibly simple and easy to use.
Once you are used to it and have made a few trades with it, you’ll find that you’re spending very little time actually running with this system.
This is an extremely low risk, high reward strategy which can and will change your life if you use it properly.
- Best Time Frame: Daily
- Most Recommended Currency Pairs: EURUSD, GBPUSD, and BITCOIN
- Mega Trend (Hull Moving Average)
- Ichimoku Kijun-Sen
- WPR
- Signal Trend
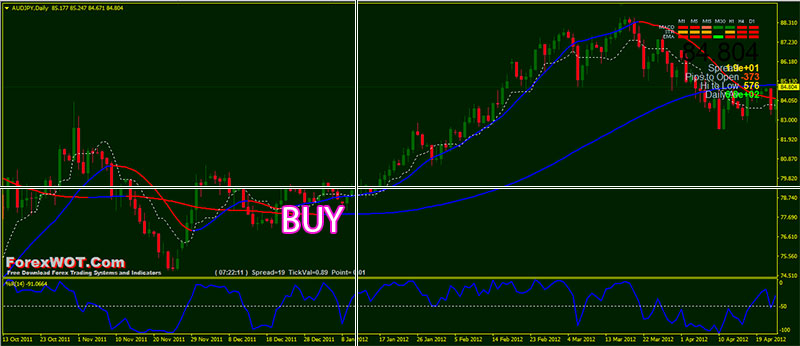
- Mega Trend (100 HMA) blue color
- Mega Trend (21 HMA) blue color
- Price upward and above Tenkan-Sen line
- WPR line upward and above -50 level
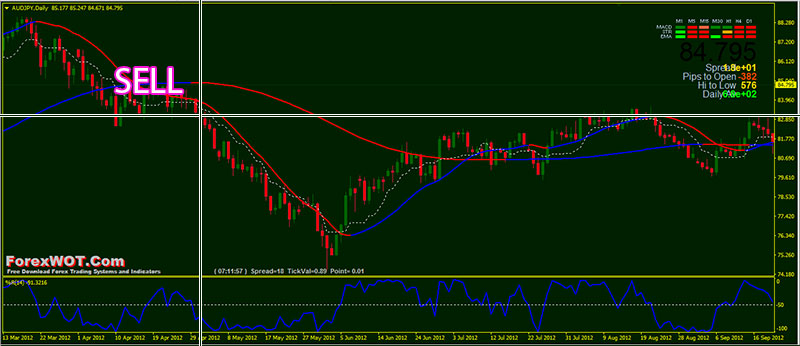
- Mega Trend (100 HMA) red color
- Mega Trend (21 HMA) red color
- Price downward and below Tenkan-Sen line
- WPR line downward and below -50 level
This is a mechanical system, which means you will be getting fixed entry signals which tell you exactly what to do and when. So there is nothing left open for you to “interpret” or make mistakes with.
This is very much a case of “when A meets B, do C”.
Pure simple instructions of what to do and when to do it!
The only thing that could make this system fail over the long term is you not sticking to the rules…….that’s it!
If you stick to the rules of the system, you’re going to be smiling from ear to ear as you watch your account grow at an astonishing rate every month from now on.




Can I also use this system on other pairs?