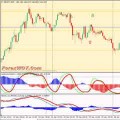
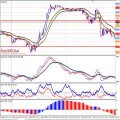
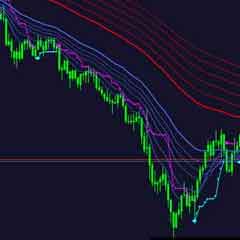
Learn Forex Trading Online – Highly Profitable Forex Currency Trend Following Trading Strategy. FGM MACD Profitable Trading is a trend following strategy for intraday trading or swing. It’s based only on trend indicators. This strategy is very simple and clear.
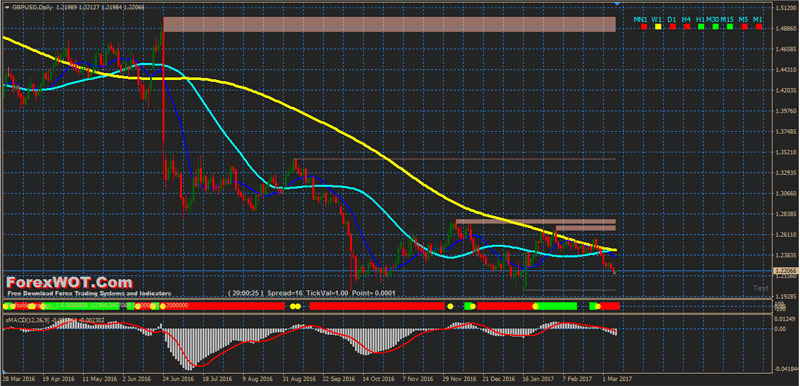
MACD is an extremely popular indicator used in technical analysis. MACD can be used to identify aspects of a security’s overall trend. Most notably these aspects are momentum, as well as trend direction and duration.
What makes MACD so informative is that it is actually the combination of two different types of indicators.
- First, MACD employs two Moving Averages of varying lengths (which are lagging indicators) to identify trend direction and duration.
- Then, MACD takes the difference in values between those two Moving Averages (MACD Line) and an EMA of those Moving Averages (Signal Line) and plots that difference between the two lines as a histogram which oscillates above and below a center Zero Line.
The histogram is used as a good indication of a security’s momentum.
Trading Rules FGM MACD Profitable Strategy
To fully understand the MACD indicator, it is first necessary to break down each of the indicator’s components.
The Three Major Components
- The MACD Line
MACD Line is a result of taking a longer term EMA and subtracting it from a shorter term EMA.
The most commonly used values are 26 days for the longer term EMA and 12 days for the shorter term EMA, but it is the trader’s choice.
- The Signal Line
The Signal Line is an EMA of the MACD Line described in Component 1.
The trader can choose what period length EMA to use for the Signal Line however 9 is the most common.
- The MACD Histogram
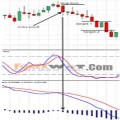
As time advances, the difference between the MACD Line and Signal Line will continually differ. The MACD histogram takes that difference and plots it into an easily readable histogram. The difference between the two lines oscillates around a Zero Line.
When the MACD histogram is above the Zero Line, the MACD is considered positive and when it is below the Zero Line, the MACD is considered negative.
A general interpretation of MACD is that when MACD is positive and the histogram value is increasing, then upside momentum is increasing. When MACD is negative and the histogram value is decreasing, then downside momentum is increasing.
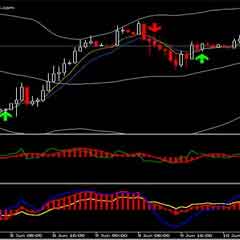
SELL Rules
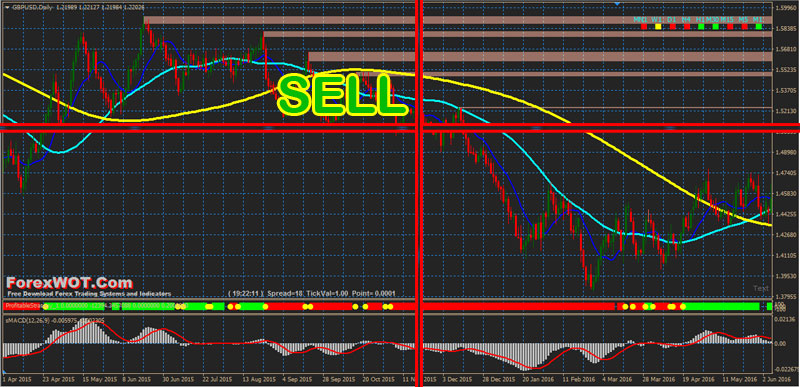
- MACD Histogram below 0 level
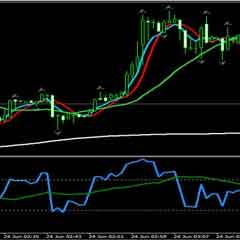
- When the blue line crosses the aqua line from the top, prepare for a trade, but not yet.
- Once the yellow line is crossed as well, then take the sell trade. Sometimes it will cross both at once or sometimes it will take a little time to form.
- Profitable strategy indicator alias FX prime confirm with red bar.
BUY Rules
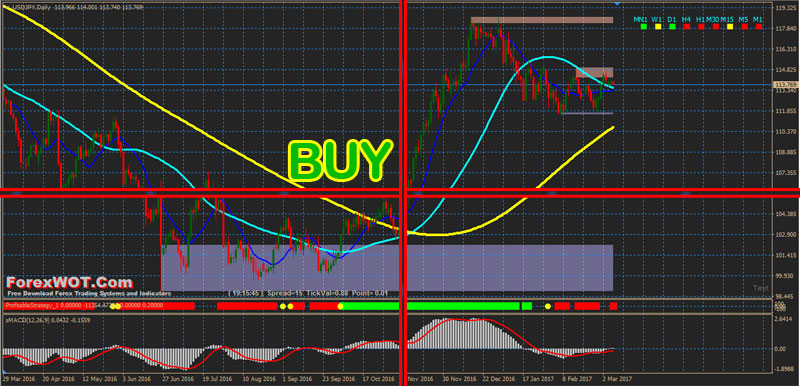
- MACD Histogram above 0 level
- When the blue line crosses the aqua line from the bottom, prepare for a trade, but not yet.
- Once the yellow line is crossed as well, then take the buy trade. Sometimes it will cross both at once or sometimes it will take a little time to form.
- Profitable strategy indicator alias FX prime confirm with blue bar.
EXIT Rules
- Ratio 1.5 or 1:2 stop loss ( iniatial stop loss on the previous swing);
- For Long entry : when the blue line crosses the aqua blue (light blue line) from the top to bottom, close the trade.
- For Short entry: when the blue line crosses the aqua line from the bottom to top, close the trade.
FGM MACD Advantage : good ratio profi/loss.
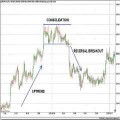
FGM MACD Disavantage : the system decreases the efficiency in the side ways it is important to apply this template to trending market.


