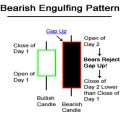
The Bullish Engulfing Candlestick Pattern is a bullish reversal pattern, usually occuring at the bottom of a downtrend. The pattern consists of two Candlesticks:
A bullish engulfing pattern is a chart pattern that forms when a small black candlestick is followed by a large white candlestick that completely eclipses or “engulfs” the previous day’s candlestick. The shadows or tails of the small candlestick are short, which enables the body of the large candlestick to cover the entire candlestick from the previous day.

– Larger Bullish Candle (Day 2)
The bearish candle real body of Day 1 is usually contained within the real body of the bullish candle of Day 2.
On Day 2, the market gaps down; however, the bears do not get very far before bulls take over and push prices higher, filling in the gap down from the morning’s open and pushing prices past the previous day’s open.
The interpretive power of the Bullish Engulfing Pattern comes from the incredible change of sentiment from a bearish gap down in the morning, to a large bullish real body candle that closes at the highs of the day. Bears have overstayed their welcome and bulls have taken control of the market.
As implied in its name, this trend suggests the bulls have taken control of a security’s price movement from the bears. This type of pattern usually accompanies a declining trend in a security, suggesting a low or end to a security’s decline has occurred. However, as usual in candlestick analysis, the trader must take the preceding and following days’ prices into account before making any decisions regarding the security.
Bullish engulfing candles indicate immense buying interest that swallows the range of the prior candlestick low and surpasses the candlestick highs.
The buying action is frenzied as the candle usually closes at its highs with little to no upper wick. This in turn triggers more buyers who spill over into the next candle. If the next candle closes higher than the bullish engulfing pattern, the next leg of the uptrend usually forms.
Bullish Engulfing Candle Reversals
Where a bullish engulfing candle forms in the context of a trend is one of the most important factors. When a bullish engulfing candle forms at the end of a downtrend, the reversal is much more powerful as it represents a capitulation bottom.
The lows of the candle should be the low of the downtrend. This is usually preceded by a minimum of four consecutive lower low candles prior to the bullish engulfing candle, which should close near the candle highs.
When the next candle closes above the bullish engulfing candle, it forms a market structure low trigger, which is the high of the proceeding candlestick. When that high is broken, then an official trend reversal forms.
For example, if XYZ is in a downtrend that has shown five consecutive lower candle closes at 25.20, 25, 24.80, 24.70 and 24.60, then it forms a bullish engulfing candle with a low of 24.30 that bounces and closes at 24.80.
The next candle has a high of 25 and closes at 24.95. This sets up the market structure low trend reversal trigger if 25 can break, which is the high of the prior candle. In this case, the stock breaks 25 to trigger a surge that spikes the stock up to 25.30 and reverses XYZ back into an uptrend.
The bullish engulfing candle reversal is much stronger than a typical hammer type reversal since the body completely engulfs the prior candle indicating a buying frenzy.


