Filtered Forex MBFX ( SELL Top and BUY Bottom ) Price Action Trading System – High Accuracy Forex MBFX Support Resistance Trading with Best Trend Filter Indicator mt4. I am always interested in buying lows and selling highs :-).


I’ve found really helpful methods (Forex MBFX Support Resistance Trading) – especially based on pure Price Action and supply/demand.
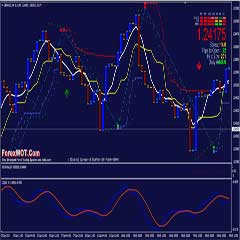
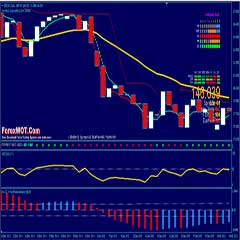
I like the simple principle of Center of Gravity (COG) or Polinomial Regression Indicator, when price reaches the extremes (red/green lines) It will work its way back to the center of gravity (blue line).
Price Action Trading
There is no true definition of these terms, but in simple English, it is a trading technique that allows you to read the market and make trading decisions based on the actual price movements or action of prices as they undulate and print to a chart, rather than relying on lagging indicators.
Most indicators are derived from past prices on the chart, so they are in fact, giving you information on lagging price movements.
Price Action Trading Works Better on Longer Time Frames.
Since this Forex Trading System is based on Price Action you can trade any time frame from one hour and above.
I mainly concentrate on the one hour, four hour and daily charts. These are consistently the most profitable, as the patterns are easier to spot and lead to more consistent profits.
MBFX Price Action Support Resistance Trading Rules
Primarily, I use two forms of Price Action Analysis:
- Support and Resistance Lines. In this trading system we also use Center of Gravity (COG) or Polinomial Regression Indicator as support resistance.
- Candlestick Analysis. Pin Bar is the most powerful candlestick pattern.
- Trend Momentum Analysis. CCi and Stochastic Oscillator indicator is a good solution.
What is Pin Bar?…
The Pin Bar is very different from other reversal candlestick chart formations because it is a bar/candlestick with a long tail or wick, a very short body.
The name itself (the pin “bar”) refers to using a bar chart but I prefer using candlestick charts but lets keep the name pin “bar” as it is, ok?
This is a more detailed analysis of the pin bar, if you don’t like this, you may skip down to search for the Pin Bar Trading Strategy’s Rules.
- For a BEARISH Pin Bar Formation:
The very long tail tells you that the bulls took over and pushed the price a very long way up to form a high, but that high was not maintained.
The bears came with such a great force and took over and pushed price down all the way, wiping away all the price gains made by the bulls.
The price fell, made a low and then close a little bit below the opening price in the red.
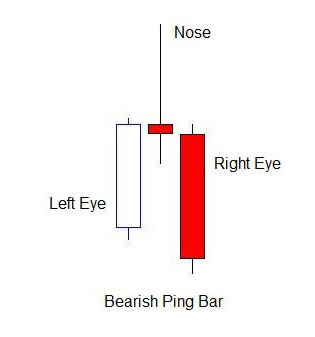
So what does this mean?... It means the when you see such a bearish pin bar formation, you should be very alert that the bears are now most likely taking over the market and will continue to push price down.
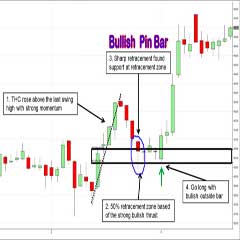
- For a BULLISH Pin Bar Formation:
A bullish pin bar formation is the exact opposite of the bearish pin bar formation: the long tail tells you that initially, the bears took control of the market and pushed the price all the way down to make a low but this low was not sustained.
After the low was made, the bulls took over with such ferocity and force and pushed the price all the way up, completely wiping all the downward price moves made by the bears and making a high and finally closing a little bit below the high in the green.
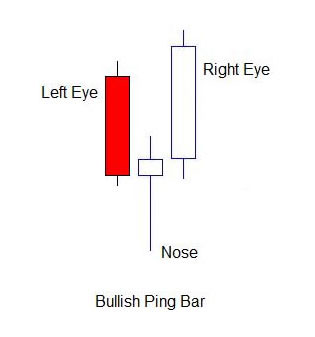
It means that when you see such a candlestick formation, you should be alert now that that bulls are most likely taking over the market and will continue to push price up.
BUY Rules
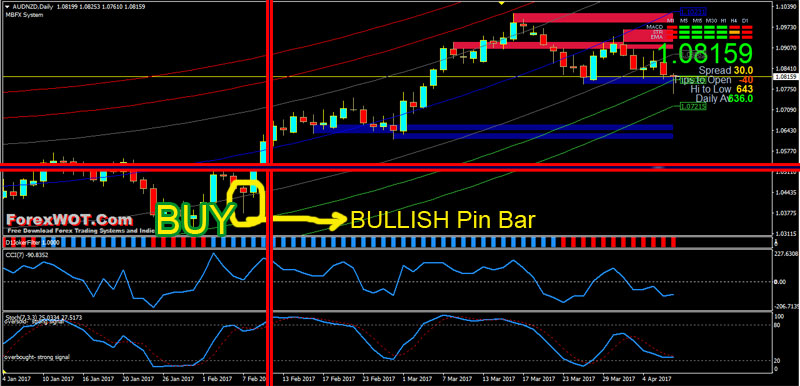
- Bullish Pin Bar
- Center of Gravity (COG) or Polinomial Regression Indicator upward
- D1 JokeFilter Indicator blue color
- CCI line upward and above 0 level
- Stochstic oschillator upward
SELL Rules
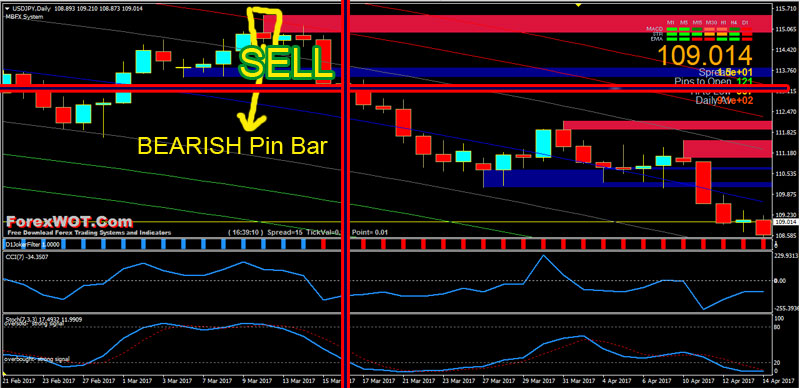
- Bearish Pin Bar
- Center of Gravity (COG) or Polinomial Regression Indicator downward
- D1 JokeFilter Indicator red color
- CCI line downward and below 0 level
- Stochstic oschillator downward
Pin Bar Price Action Trading Notes
BEST LOCATIONS TO TRADE THE PIN BAR – This is one very important criteria if you are looking to trade the pin bar: you just cannot trade all the pin bars you see.
It does not make any sense at all to trade all the Pin Bars You see because of one very simple reason: the location of where the pin bar forms impacts you probability of success.
So the best places to trade pin bars are these:
- Fibonacci levels of 31.8, 50 & 61.8
- Major support levels
- Major resistance levels
- traders action zone
- pivot levels
- trendline bounces
I believe the larger timeframes are the best timeframes to trade the pin bar. So you should be looking at pin bars in the 1hr, 4hr and foremost DAILY timeframes.
 Forex Price Action Trading System : The Simple System to Better Pin Bar Price Action Trading
 How Do I Become a Good and Prifitable Forex Trader
 Forex Price Action Short Course : 50% Retracement Pin Bar Auto Zig-Zag Fibonacci Price Action Trading System and Strategy
 Trend Reversal Trading: Best Forex & Stock SuperTrend Pin Bar Price Action System
 STOCHASTIC Trend Reversal Trading System : How to Identify And Trade Trend Reversals in Sideways Forex Market
 High Accuracy Volty Channel Stop RSI Trading Strategy and How to Win Consistently in Forex Trading
 Best High Accuracy Candlestick Patterns “Price Action” Trading System and Strategy Every Trader Should Know
 Forex Bill Williams Market Facilitation Index (BW MFI) Multi Trend Trading System and Strategy
 Online Forex Trading – Donchian Channel Breakout Forex Scalping Strategy
 Highly Effective Forex Risk Management And Position Sizing Strategy
