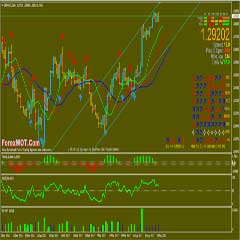
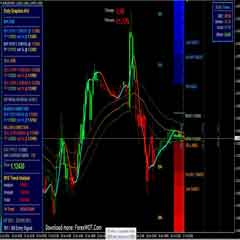
Advanced Exponential Moving Average (EMA) CrossOver Forex Trading System and Strategy. The EMA is very popular in forex trading, so much so that it is often the basis of a trader’s main trading strategy.
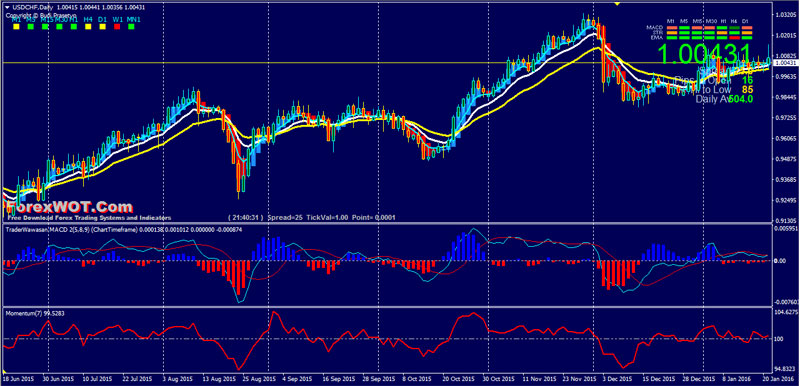
A common forex trading strategy using EMAs is to select a shorter-term EMA and a longer-term EMA, and to trade based on the position of the short-term EMA in relation to the long-term EMA.
A trader enters BUY orders when the short-term EMA crosses above the long-term EMA or enters SELL orders when the short-term EMA crosses below the long-term EMA.
The most commonly used EMAs by forex traders are the 5, 10, 12, 20, 26, 50, 100, and 200.
Traders operating off of shorter time frame charts, such as the five- or 15-minute charts, are more likely to use shorter-term EMAs, such as the 5 and 10.
Traders looking at higher time frames also tend to look at higher EMAs, such as the 20 and 50. The 50, 100 and 200 EMAs are considered especially significant for longer-term trend trading.
ForexWOT.Com EMA CrossOver Trading Rules
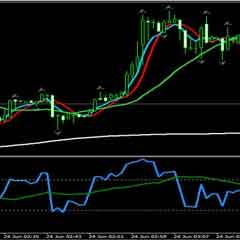
We use crossovers of the 20 EMA by the 5 or 10 EMA as trading signals.
As long as the price remains above the chosen EMA level (20, 10, and 5) the trader remains on the BUY side; if the price is below the level of the selected EMA, the trader is a SELLER unless price crosses to the upside of the EMA.
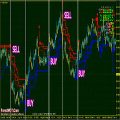
BUY Rules
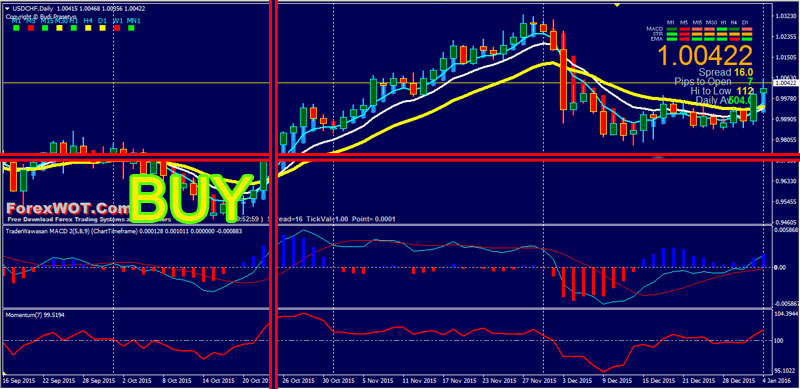
- The price above 20 EMA, 10 EMA, and 5 EMA
- GP MACD blue histogram and above 0 level
- Momentum line upward and above 100 level
- Heiken Ashi candles green color
SELL Rules

- The price below 20 EMA, 10 EMA, and 5 EMA
- GP MACD red histogram and below 0 level
- Momentum line downward and below 100 level
- Heiken Ashi candles red color
EMA CrossOver Forex Trading Note
However, moving averages alone are rarely the totality of a trading strategy, and most traders complement their use of moving averages with other technical indicators.
While it is difficult to determine the absolute “BEST” technical indicators to support a basic moving average strategy, a couple of the most common ones are trendlines and momentum indicators.
Momentum indicators, such as the average directional index, or ADX, or the moving average convergence divergence, or MACD, often indicate an upcoming change in market direction before the price moves far enough to cause a moving average crossover.


