Super Easy and Effective Trend Trading Strategy – This article is based on the assumption that prices move sideways for a large portion of the time.
While swing traders or scalpers restrict their focus to sideways phases, a trend trader devotes himself to the rest of the time because that is when larger movements occur with which profits can be made.
There are countless ways of recognizing trends early and making optimum profits from them.
Many of these approaches include COMPLEX FORMULAS or SUBJECTIVE CHART PATTERNS.
Thus there are traders who use sophisticated and individualized software or spend hours recognizing accurate pictures or sequences on charts.
Whether such behavior leads to greater success is a moot point.
The fact is that there is NO PERFECT or GUARANTEED METHOD of being profitable on the markets.
It should be clear, though, that the chances of success will increase drastically if a chosen strategy is pursued consistently and in a disciplined manner.
How simple and effective such a strategy can be as described in this article.
Above all, a criterion is required which allows a trend to be clearly determined.
One very simple method of determining a trend is the Moving Average.
- If a chart is quoted ABOVE a Moving Average line, then this indicates a BULLISH TREND.
- If BELOW that line, this is referred to as a BEARISH TREND.
This is only logical since both possibilities presuppose a previous rise or fall of the price.
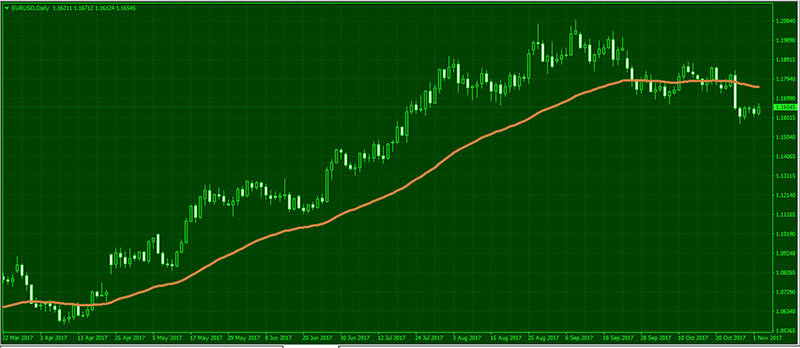
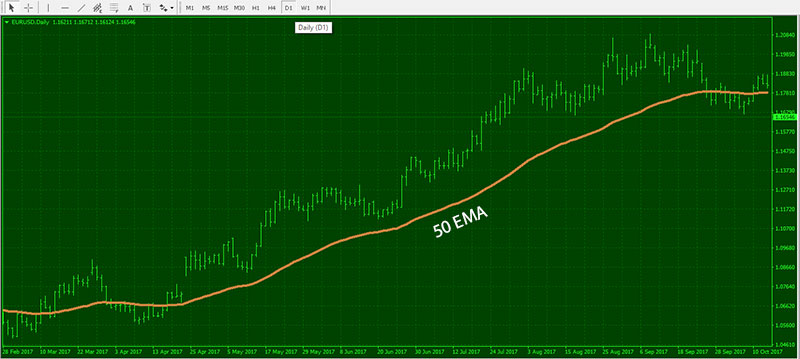
In Figure 1 this fact is illustrated by the EUR/USD chart.
Right in the chart, this was quoted far above its 50-day Moving Average – a clear UPTREND is visible.
The drawback of using Moving Averages is that these always run either above or below the chart and therefore by definition always suggest a certain trend.
Since, however, prices run sideways for most of the time, a Moving Average alone won’t mean much.
To be sure, YOU PROFIT FROM EXISTING TRENDS,
….but in TRENDLESS PHASES, you would lose a great deal of money unnecessarily.
Take look at the figure below.
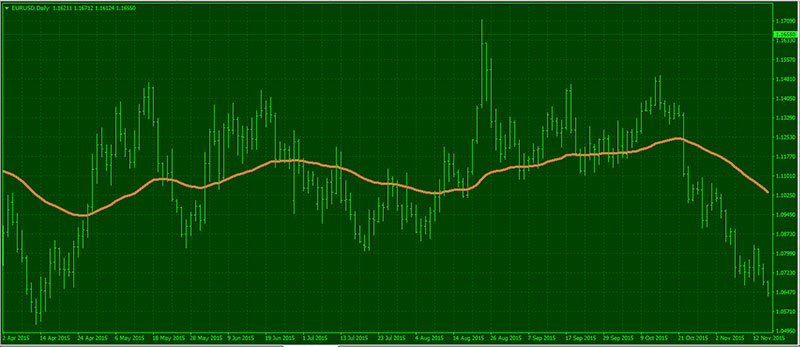
This is not the goal of a wellfounded strategy.
You need ADDITIONAL TOOLS to deal with this problem.
Read:
- EMA 120 – EMA 50: A Simple Guide for Using the Popular Moving Averages in Forex
- Best 50 & 200 EMA Renko Street Channel Forex H4 Daily Trend Following Strategy
- MACD Trading System – Highly Profitable Forex Currency Trading Strategy With Twin 50 EMA and MACD
- Forex Trend EMA 20-50 CCI RSI Trading System: How to Find Trends and How to Profit from Trend Trading
Before blindly trading long or short, you should have given some serious thought about the entry.
Which situation is best?…
To find a reliable answer, you should consult another indicator.
While a moving average determines the trend as a whole, oscillators serve to recognize good entry opportunities.
One good and the well-known oscillator is the Relative Strength Index (RSI for short), which is included in any appropriate analysis software or online application.
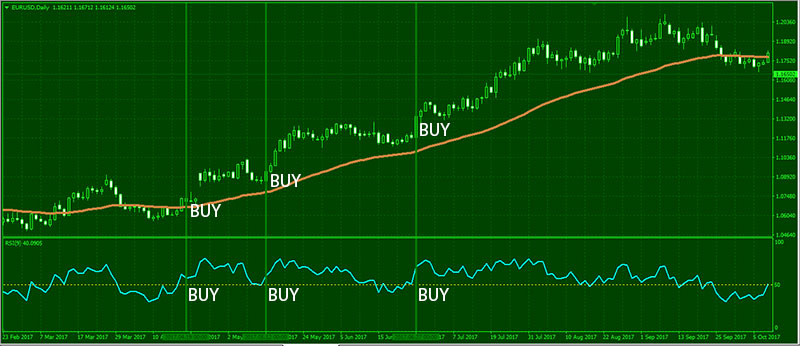
- If this has a value of more than 50 level, then this provides a BUY signal.
- Values below 50 level signify a SELL signal.
Alternatively, there would also be the slow stochastic indicator.
In Figure 2 the chart from Figure 1 has now been expanded by the RSI.
As can be seen immediately, this additional criterion cannot yet produce any results to write home about.
Two indicators do not make a strategy.
To be sure, they provide interesting trends and entry signals, but you won’t have any success with many of them.
You need to further narrow down the existing signals and, using INTELLIGENT FILTERING METHODS, tease out those that allow promising trades.
So you would have to define the trends a bit more clearly at this point and add another criterion to the entry.
The questions are:
Which trend is a good trend?…
Which entry really seems to be a good choice?…
What looks like a trend in the big picture certainly is one on a smaller scale.
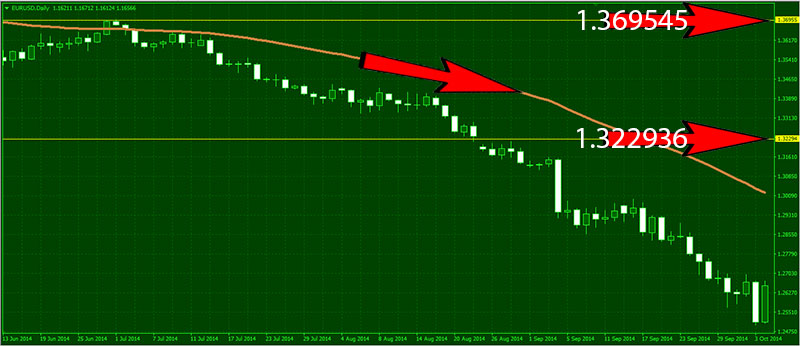
If the EUR/USD drops from over 1.369545 to just under 1.322936 points, then this movement has extended over each day and each hour.
Correct.
It is true that there was one or the other strong countermovement, but THE GENERAL TREND no doubt was primarily DOWNWARD.
The use of at least two-time frames provides considerable support to determine the trend.
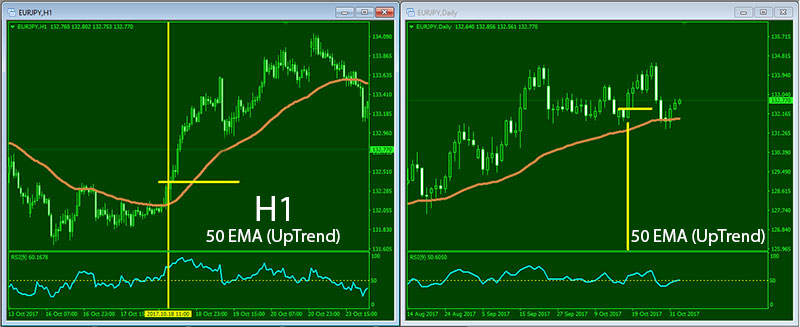
For example, EUR/JPY BUY Signal
…you take a Daily chart and an Hourly chart and provide both with the same Moving Average.
Only if both the Daily and the Hourly charts indicate a BULLISH or BEARISH trend is there any search for an entry on the smaller time frame.
If the two charts CONTRADICT each other, the trend is not clear enough…!!!
The final criterion concerns a REFINEMENT of THE ENTRY.
After all, the goal is to perceive a trend whenever it is developing or its appearance becomes probable, but nonetheless, the necessary intensity exists.
A promising situation exists when the price consolidates above an average line and additionally, the RSI upward above 50 level suggesting an UpTrend moment (in the case of a BUY trade).
However,
….the trend should not have developed too far, i.e. the price should not have moved too far from the 50 Moving Average.
The final thing that needs to be thought through ahead of time is the EXIT.
This is relatively simple in the case of such a trend-following approach.
Since a BUY trade is always entered above and a SELL trade only below the Moving Average line and the exits are located close to this line, you can use a TRAILING STOP on the basis of the Moving Average.
Depending on whether you would act more aggressively or defensively, you can give the trade a little more room and place the stop a few ticks behind the respective line.
Furthermore, it makes sense for a trade to be ended even if has again moved some distance away from a previous high or low – the Moving Average is sluggish and in this respect reduces the profits resulting from short-lived exaggerations.
But it is these very profits that you should have set your sights on, no matter whether you trade BUY or SELL.
- The Moving Average (50 periods) determines the trend, the RSI the entry point.
- Only when in the superior time frame the moving average confirms the trend is the trade entered.
- The price must not be more than a certain value away from the Moving Average.
- The RSI is below 50 level (SELL trade) or above 50 level (BUY trade).
- The Moving Average acts as a Trailing Stop (if necessary, with longer distance).
Figure “EUR/JPY BUY Signal” above or below shows theEUR/JPY on a Daily and Hourly basis.

It is quoted well below the 50-day Moving Average.
If the Hourly chart confirms this UpTrend, then a BUY trade can be opened provided this is what all the other criteria allow as well.
On the Hourly chart, it comes to a model entry situation.
During a consolidation within the “NOT TOO FAR” distance to the average the RSI adopts a value of above 50 level and the BUY trade is opened.
The Trailing Stop runs along the average line.
Since prices rebound again ten points from the subsequently reached low, the position is closed profitably.
Successful trend trading need not be complicated – it is enough for logical criteria to be established and adhered to by traders.
However, it is not enough for a trend to merely be defined, you also need to have had some sound thoughts about entry and exit.
As a trend trader, it makes sense to ENTER IN PHASES OF CONSOLIDATION and to pursue a current position by means a TRAILING STOP.
In this way developing trends can be made use of effectively.


