We will teach you “How To Identify Highest Win Rate Scalping and Swing Trading Setups” that No-one Ever Told You. It is simple to learn and not confusing. So, by the time you finish this tutorial, you’ll know exactly when to enter high probability trade using the most accurate Price Action trading strategy.

Knowing Price Action is super important for trading opportunities and is used a lot by smart Forex and stock traders.
Sadly, many traders struggle to spot valid “Price Action Signals” with a good chance of winning, putting their trades at risk. Doing Forex and stock trading without reading price action can be risky and cause big losses.
So, in this advanced guide, we’ll learn the easiest ways to do price action trading, explore different types, and give a detailed guide on spotting Price Action Signals that have the best chance of winning.
We’ll reveal the rules and criteria needed to recognize high probability Price Action Signals in the real market and demonstrate when to enter and exit using custom indicators and the Price Action Signals happening in the market.
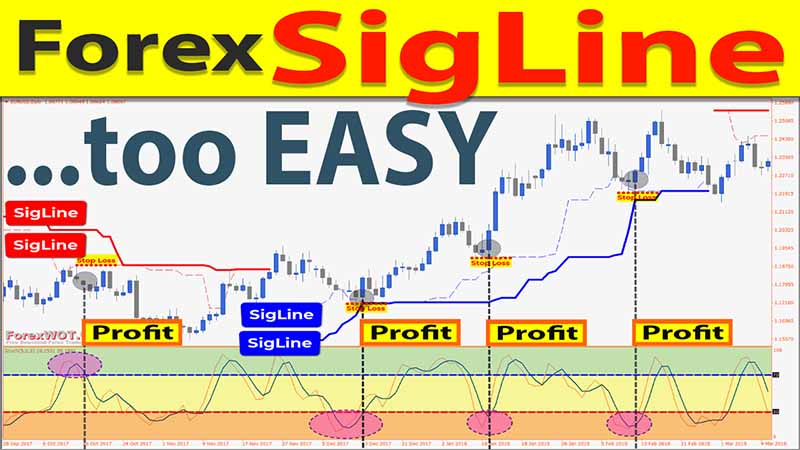
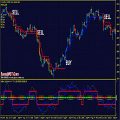
The most profitable way to use the SigLine indicator in trading is by using price action signals as triggers for our BUY or SELL positions in the SigLine area. To introduce you to the greatness of this indicator, let’s start by analyzing the market using these key indicators.
One of the most famous indicators is the Stochastic Oscillator. So, here’s the SigLine Trading using the Stockhastic Oscillator.
Alright, these are the BUY rules we need to follow before opening a position.
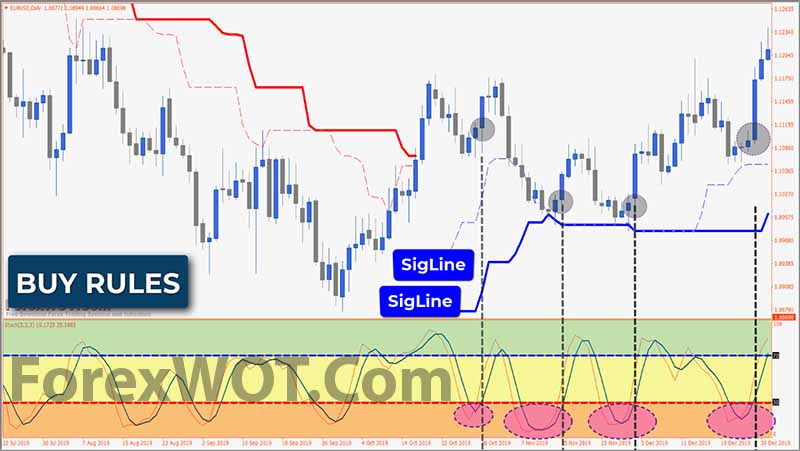
First. The SigLine is blue.
This shows that the market trend is bullish, and we’re only looking for buy signals indicated by the Stochastic oscillator. In this market condition, traders should wait for the market to correct prices towards the oversold area but still stay above the SigLine.
Second. The Stochastic Oscillator line is in the oversold area, which in this strategy is below level 30.
Third. Initiate a BUY position when the Stochastic oscillator line moves above the level 30. Once the BUY order is executed, immediately place a stop loss below the nearest swing low. Your minimum target should be twice the risk you’re taking.
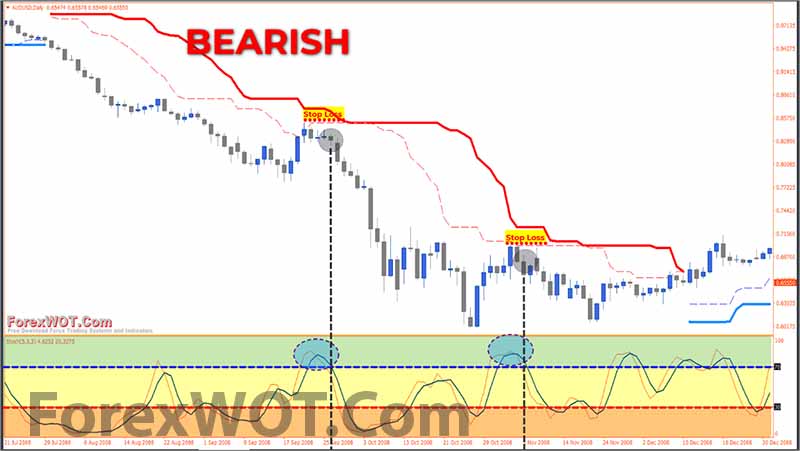
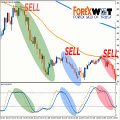
On the flip side, here are the SELL rules to follow before opening a position.
First. The SigLine is red.
This shows a bearish market trend, and we’re only searching for SELL signals indicated by the Stockhastic oscillator. In this market condition, traders should wait for the market to correct prices towards the overbought area but still stay below the SigLine.
Second. The Stockhastic Oscillator line is in the overbought area, which in this strategy is above level 70.
Third. Initiate a SELL position when the Stockhastic oscillator line drops below level 70. Once the SELL order is executed, immediately place a stop loss above the nearest swing high. Your minimum target should be twice the risk you’re taking.
- Download “ForexWOT-SigLineStochasticSystem” (Zip/RAR File).
- Copy mq4 and ex4 files to your Metatrader Directory …/experts/indicators/
- Copy the “ForexWOT-SigLineStochasticSystem.tpl” file (template) to your Metatrader Directory …/templates /
- Start or restart your Metatrader Client.
- Select Chart and Timeframe where you want to test your forex system.
- Right-click on your trading chart and hover on “Template”.
- Move right to select “ForexWOT-SigLineStochasticSystem” trading system and strategy.
- You will see the “ForexWOT-SigLineStochasticSystem” is available on your Chart.
- The best spot to open a SELL position in this case is on the red line of the SigLine indicator.
- The best spot to open a BUY position in this case is on the blue line of the SigLine indicator.
Keep in mind, trading with price action context is a skill that works on any instrument, time frame or environment.
If you’re learning a price action strategy or approach that only works on specific time frames, then it’s a limited strategy that doesn’t really understand price action context.
 The Best Way to Learn Forex Trading
 20 Halloween Costumes From Amazon All Traders will Actually Want To Wear
 Top 10 BEST Forex Trading Strategy and Indicators
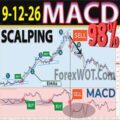
 2 MACD Effortless Forex & Stocks Swing Trading Strategy
 FOREX SCALPING: 5-Minute EMA Stochastic SCALPING Strategy (High Winrate Strategy)
 Forex & Stocks 50-period EMA SuperTrend SCALPING Strategy
 9-12-26 EMA-MACD Trading Strategy (FULL TUTORIAL for Beginners)
 Top 5 Best Forex Stochastic Oscillator Trading Strategies That Work
 Trade Without RISK – Test Your ForexWOT Trading Systems NOW…!!!
 Parabolic SAR Trading with EMA, ADX, and SLOW STOCHASTIC Indicators
