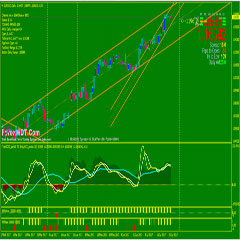
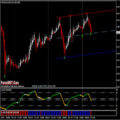
Best Forex Binary Options Trendline-Channel Analysis. In this article I’ll show you is how to trade the Trendline-Channel for high probability trades. Getting used to drawing trend lines takes a bit of time, but this trading system gives you a clear Trendline-Channel automatically.
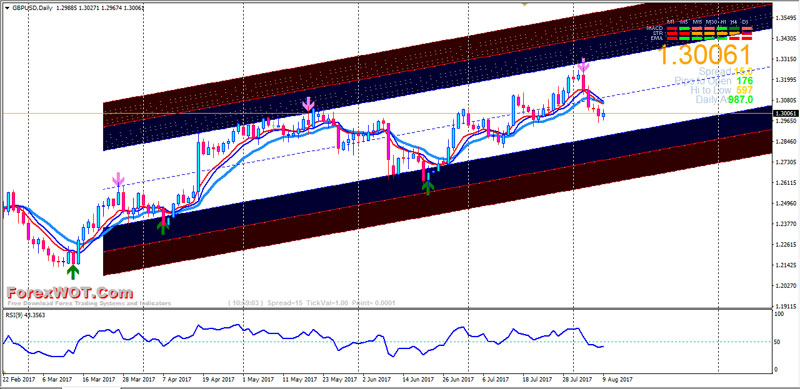
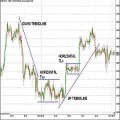
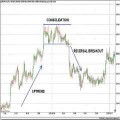
A price channel is a continuation pattern that slopes up or down and is bound by an upper and lower trend line. The upper trend line marks resistance and the lower trend line marks support.
Price channels with negative slopes (down) are considered bearish and those with positive slopes (up) bullish.
For explanatory purposes, a “BULLISH Price Channel” will refer to a channel with positive slope and a “BEARISH Price Channel” to a channel with a negative slope.
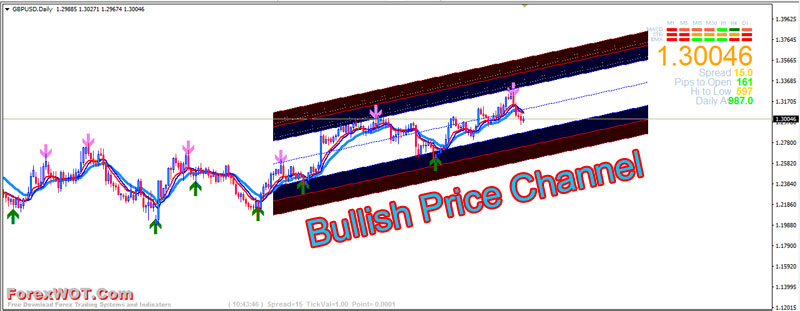
- BULLISH Price Channel: As long as prices advance and trade within the channel, the trend is considered bullish. The first warning of a trend change occurs when prices fall short of channel line resistance. A subsequent break below main trend line support would provide further indication of a trend change. A break above channel line resistance would be bullish and indicate an acceleration of the advance.
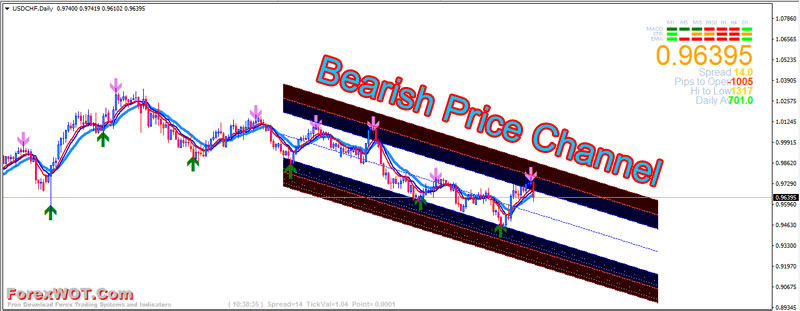
- BEARISH Price Channel: As long as prices decline and trade within the channel, the trend is considered bearish. The first warning of a trend change occurs when prices fail to reach channel line support. A subsequent break above main trend line resistance would provide further indication of a trend change. A break below channel line support would be bearish and indicate an acceleration of the decline.
In a Bullish Price Channel, some traders look to BUY when prices reach main trend line support. Conversely, some traders look to SELL (or short) when prices reach main trend line resistance in a bearish price channel. As with most price patterns, other aspects of technical analysis should be used to confirm signals.
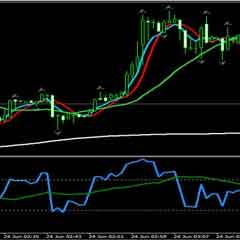
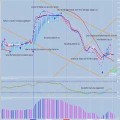
How To Trade The Trendline-Channel RSI For High Probability Trades?… Thi ForexWOT Trendline-Channel RSI Trading system is a trend following. Best time frames for the trading system are H1, H4, and Daily.
- TrendLine Channel WC NLR
- SignalTrend
- OBOS
- Exponential Moving Average
- Relative Strength Index
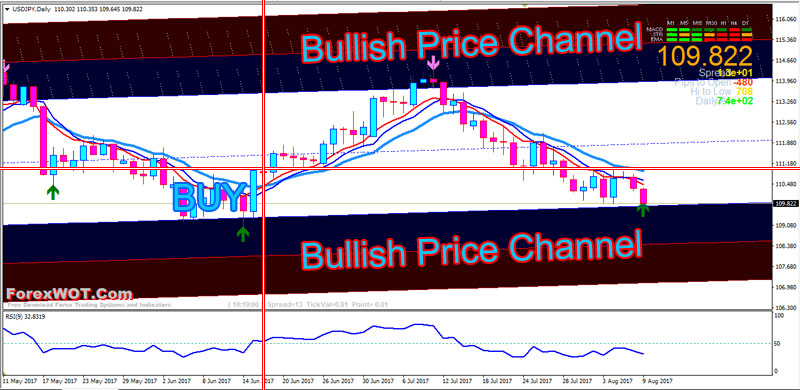
- Prices reach main trend line support of Bullish TrendLine Channel
- OBOS Green color arrow below the previous swing low candle
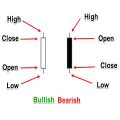
- Candle bullish and above 14 EMA and 8 EMA line
- Red color 8 EMA (open) line upward and above Blue color 8 EMA (close)
- Signal Trend Green color bars
- RSI line upward above 50 level
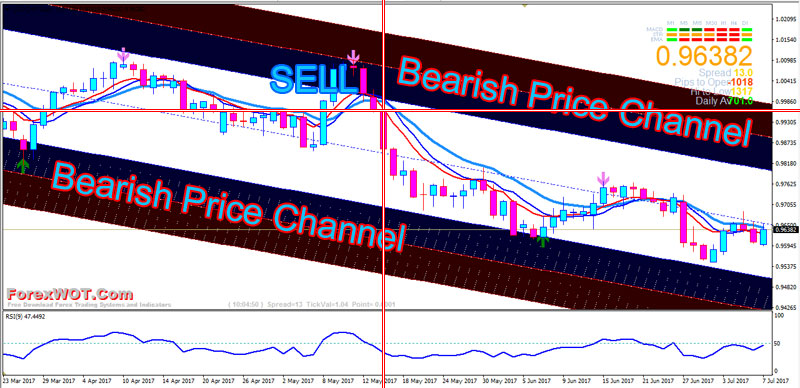
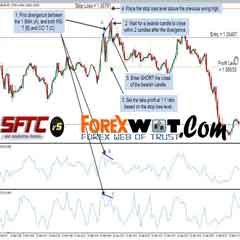
- Prices reach main trend line resistance of Bearish TrendLine Channel
- OBOS Magenta color arrow above the previous swing high candle
- Candle bearish and below 14 EMA and 8 EMA line
- Red color 8 EMA (open) line downward and below Blue color 8 EMA (close)
- Signal Trend Red color bars
- RSI line downward below 50 level
Because the technical analysis is just as much art as it is science, there is room for flexibility.
Even though exact trend line touches are ideal, it is up to each individual to judge the relevance and placement of both the main trend line and the channel line.
By that same token, a channel line that is exactly parallel to the main trend line is ideal.


