The trend is your friend…! – This is a high accuracy “Trend and Momentum Continuation PRICE ACTION Trading Strategy“.
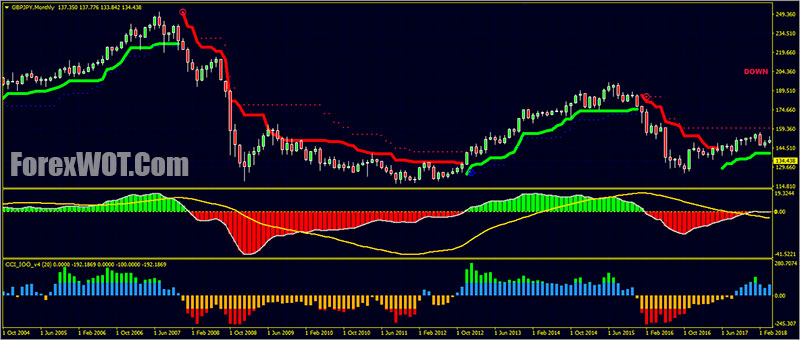
This trite The trend is your friend… saying is said again and again because it’s true.
- Time frame: M15 or higher
- Currency Pairs: Any
- Chandelier EXIT
- ABC Trending
- 100Pips Momentum
- FT MACD
- CCI NUF
Simple and high accuracy Trend and Momentum Continuation PRICE ACTION Trading Strategy. The first thing that we would need to know in this strategy is “how to identify the trend“.
How else can we trade with the trend if we do not know what the trend is?
Can you identify the trend on this chart below?
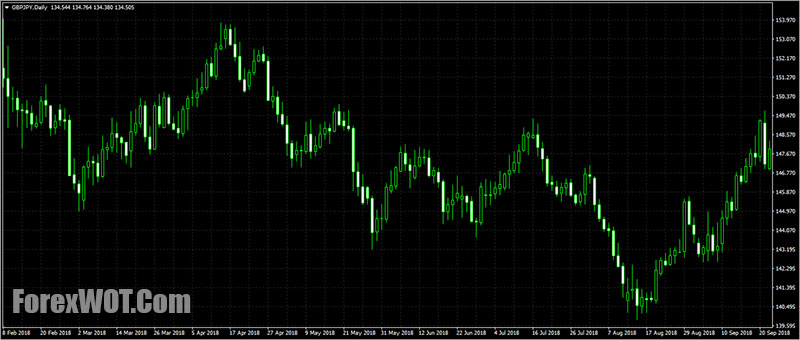
Trained eyes could easily identify it is going up. But to the untrained eye, it would be a little harder to decide.
Just a little trick to make things easier for you to identify the trend, use this “ForexWOT.Com-TrendMomentumContinuationSystemBASIC” template.
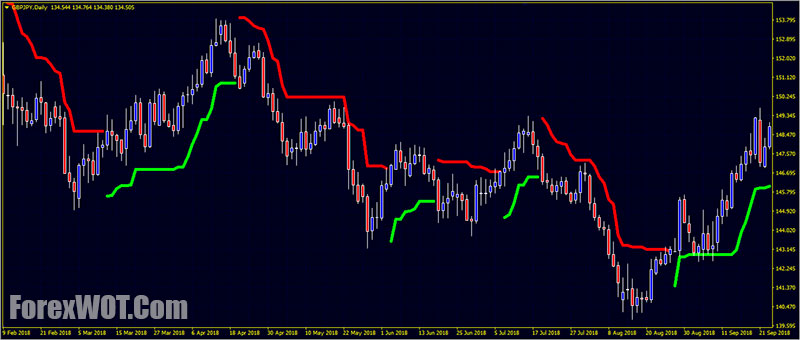
Does that line make things easier to decide which way the trend is going…?
If the price is above the lime line, then the trend is up. If the price is below the red line, then the trend is down.
Price action is the movement of a security’s price plotted over time.
Price action forms the basis for all technical analysis of a stock, commodity or other asset charts.
Many short-term traders rely exclusively on price action and the formations and trends extrapolated from it to make trading decisions.
Technical analysis as a practice is a derivative of price action since it uses past prices in calculations that can then be used to inform trading decisions.
- Download “ForexWOT.Com-TrendMomentumContinuationSystem” (Zip/RAR File).
- Copy mq4 and ex4 files to your Metatrader Directory …/experts/indicators/
- Copy the “ForexWOT.Com-TrendMomentumContinuationSystem.tpl” file (template) to your Metatrader Directory …/templates /
- Start or restart your Metatrader Client.
- Select Chart and Timeframe where you want to test your forex system.
- Right-click on your trading chart and hover on “Template”.
- Move right to select “ForexWOT.Com-TrendMomentumContinuationSystem” trading system and strategy
- You will see “Simple Trend Momentum Continuation PRICE ACTION Trading System” is available on your Chart
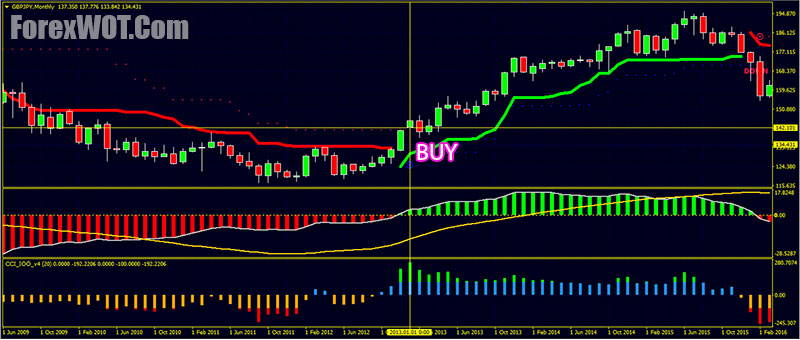
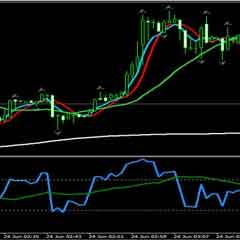
- Chandelier EXIT: Lime line
- ABC Trending: Blue dots
- FT MACD: Lime histogram and above the MA line
- CCI NUF: Blue histogram
- Price Action signal: Enter a BUY market order on the close of a bullish price action signal
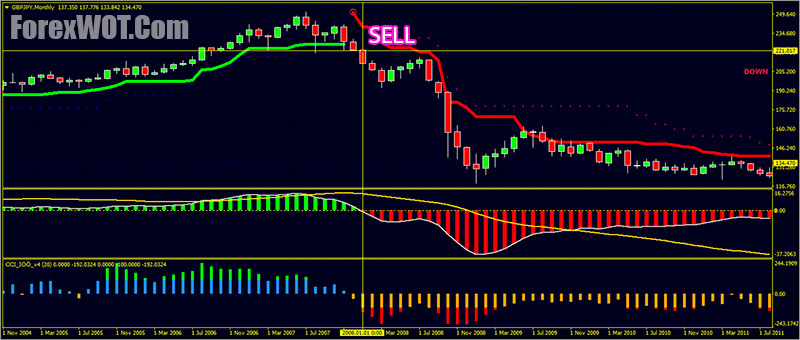
- Chandelier EXIT: Red line
- ABC Trending: Red dots
- FT MACD: Red histogram and below the MA line
- CCI NUF: Yellow histogram
- Price Action signal: Enter a SELL market order on the close of a bearish price action signal
The Stop-Loss should be a few pips above or below the previous candle.
With this strategy, we will be doing a manual closing of positions for our taking profits. This means we will not have a hard and fixed Target Price.
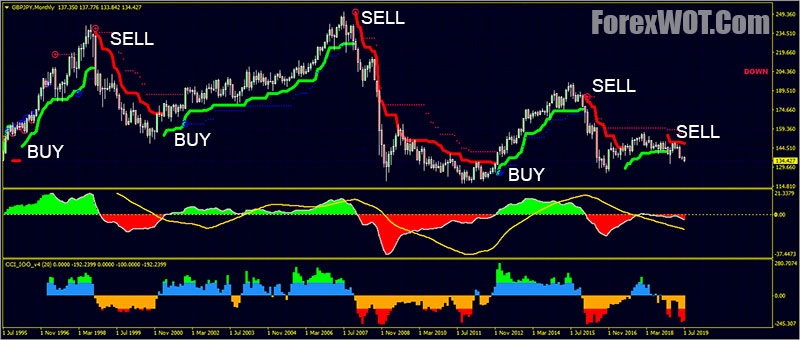
We will let the market tell us how much it wants to give us, and this will all be based on our Chandelier EXIT Indicator.
[sociallocker]
[/sociallocker]


Good trading system.
forexwot.com
You are the BEST FX site
Thank you sir
I have liked facebook and tweeted on twitter … then why download is open enabling ?
There is no download link!
It wont unlock. Please unlock it
There is no option to download the strategy