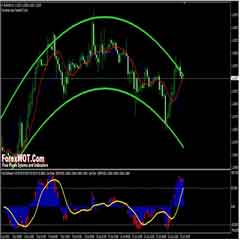
FREE DOWNLOAD “Low-Risk High Reward Total Step RSI Forex Trading System” – The Relative Strength Index (RSI) is one of the more popular technical analysis tools; it is an oscillator that measures current price strength in relation to previous prices.
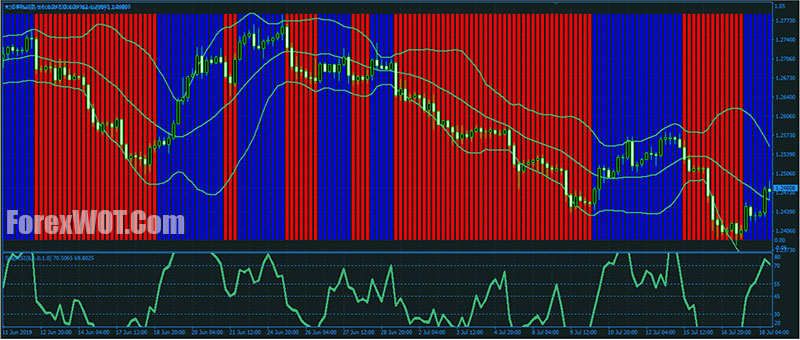
Yes, this is a low-risk high reward Relative Strength Index (RSI) trading system.
The basic principle on which the RSI operates is that it is based on historical prices of an asset. These past prices are used to calculate a number between 0 and 100.
- Best Time Frame: H1 or higher
- Currency Pairs: Any
Traditionally, levels below 30 are considered oversold and taken as a potential indication of a local bottom.
The RSI close to 100, usually above the 70 thresholds, can then be considered as a sign of a potential local top and we call levels over 70 “overbought” as there might not be much buying left.
The RSI can be a versatile tool, it might be used to:
- Generate potential buy and sell signals
- Show overbought and oversold conditions
- Confirm price movement
- Warn of potential price reversals through divergences
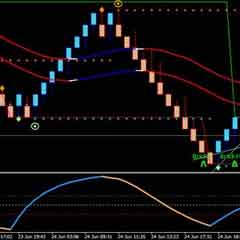
How can we make this even more concrete with a specific trading strategy based on the RSI? Let’s consider the following “Total Step RSI Forex Trading System” setup:
- Step RSI
- RSI Filter
- Bollinger Bands
- Download “ForexWOT.Com-StepRSISystem” (Zip/RAR File).
- Copy mq4 and ex4 files to your Metatrader Directory …/experts/indicators/
- Copy the “ForexWOT.Com-StepRSISystem.tpl” file (template) to your Metatrader Directory …/templates /
- Start or restart your Metatrader Client.
- Select Chart and Timeframe where you want to test your forex system.
- Right-click on your trading chart and hover on “Template”.
- Move right to select “ForexWOT.Com-StepRSISystem” trading system and strategy
- You will see “Low-Risk High Reward Total Step RSI Forex Trading System” is available on your Chart
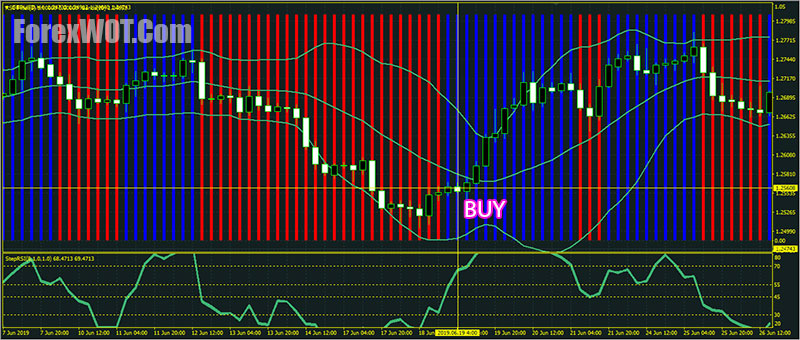
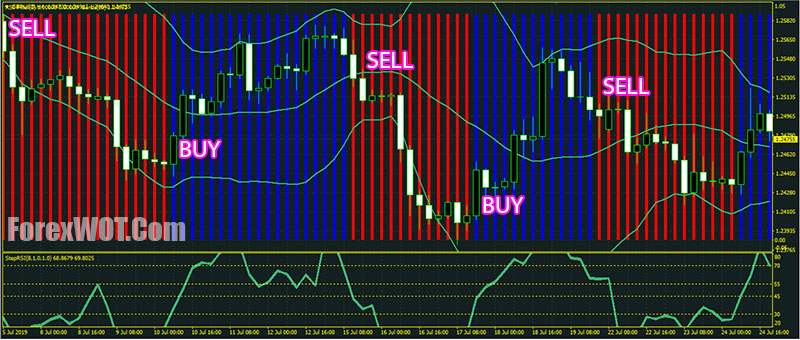
- Step RSI:
- Above level 55 line
- Upward from the oversold area (< level 30 line)
- RSI Filter: Blue
- Bollinger Bands: Price upward from the lower band
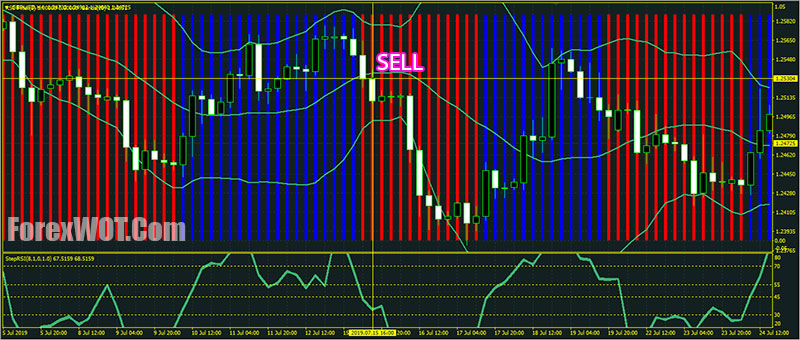
- Step RSI:
- Below level 45 line
- Downward from the overbought area (> level 70 line)
- RSI Filter: Red
- Bollinger Bands: Price downward from the upper band
RSI is one of the most popular and widely used technical indicators that provides us with many ways to generate buy and sell signals.
It can also be used to tell the general state of the market in question by identifying areas where the market is overbought and oversold.
The many ways to use the RSI makes it a flexible tool that can be used in various ways in varying market conditions.
[sociallocker]
[/sociallocker]


