Forex COG Trading Indicators and Strategy – Hi everyone and welcome to the Forex COG Master Strategy report!
In this report I’m going to introduce you to a very unique and interesting trading technique that is about as close as it gets to picking tops and bottoms.

First we’ll take a look at the FxCOGMaster indicator, then we’ll take a look at the ForexCOGMaster H indicator, and we’ll even throw in a nice filter too as our entry trigger.
So what is COG anyway and what does it mean? To be precise, it stands for Center of Gravity, and the theory basically states that price has a mean average or center of gravity that it always rotates around.
Basically, as price fluctuates up and down, it will come back to its average and return to an appropriate value. When price gets too high, it will come back down and when it gets to low, it will come back up.
We can see price do this over and over on our charts and as traders, we are constantly trying to figure out how to capture these swings.
Forex COG Trading Indicators
1. FxCOGMaster
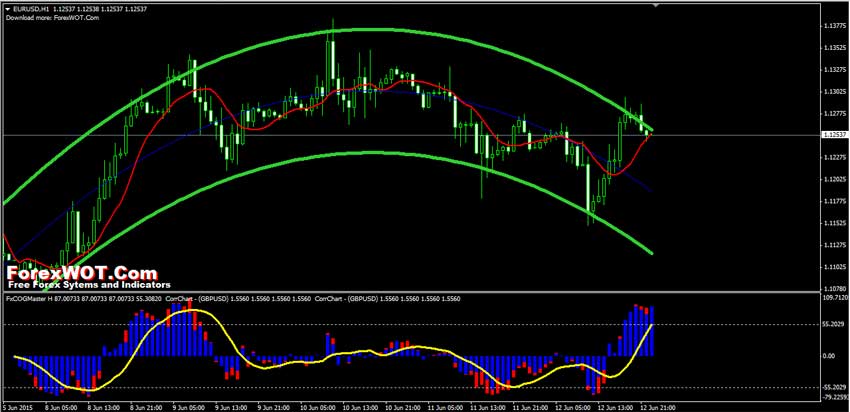
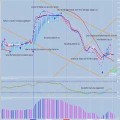
Let’s take a look at our first indicator: the FxCOGMaster and this will become a bit clearer. On the chart below, we can see the H4 chart of the EURUSD with the FxCOGMaster.
You can see that there is an upper green line that rotates over the top of price and a lower green line that rotates underneath price. There’s also a blue line that runs dead center in between. This is the center of gravity line.
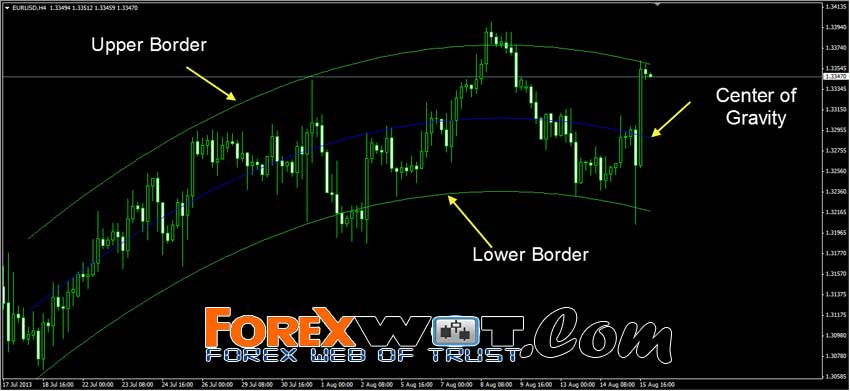
As you can see, price rotates up and down inside of the upper and lower borders and occasionally stalls in the middle, making the center of gravity line a great place to take profits, while the upper and lower borders are great places to look for buy and sell trades.
- When prices reach the upper border of the FxCOGMaster it can be said that the market is OVERBOUGHT.
On the other hand if price is at the lower border of the FxCOGMaster it can be said that the market is oversold. In both cases, there is a very high likelihood that price will return to its middle line or Center of Gravity.
2. FxCOGMaster H
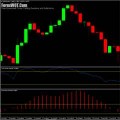
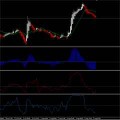
The next indicator that we’ll look at is the FxCOGMaster H. This is an oscillated representation of price in relation to the FxCOGMaster on the price chart. It looks a lot like the MACD actually but has completely different calculations. I’ve also added a 9 period SMA as a SIGNAL LINE to it.
This indicator is pretty cool! It adds an oversold and overbought line automatically depending on the value of each currency pair you add it to so it automatically calculates at what levels the indicator and price is overbought and oversold. When price is above the upper line, the market is overbought and will soon come down.
When the market is below the lower line, the market is oversold and WILL SOON RISE. The histogram also has a zero line that represents the Center of Gravity line on the FxCOGMaster price indicator.
Whenever price is above the zero line, price is above the COG line (middle line) on the FxCOGMaster on the price chart. The yellow line here is the 9 period Simple Moving Average. This is a lot quicker to pick out the reversals and doesn’t lag behind price giving you a much better entry!

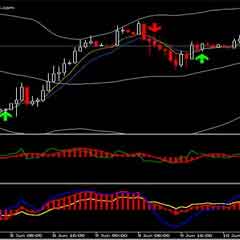
So let’s take a look at both indicators on the charts together. The similarities are pretty clear but there are some subtle differences that we need to take note of.
There will be times when price doesn’t quite get all the way to the outer lines of the FxCOGMaster on the price chart but the histogram will show overbought or oversold conditions.
This is fine as long as the signal line on the histogram is in the overbought or oversold area we can look for trades. We’ve also added a 9 period Simple Moving Average set to typical on the price chart which we will use to identify our entries.

So that’s it, have fun… just kidding! I think now is a great time to get our ground rules down so we know exactly what our plan of action is and know how and when to attack the market. Once we’ve laid out the ground rules we’ll take a look at a bunch of different buy and sell examples.
Buy Trade Rules
Follow the rules before for placing buy trades:
- On the higher time frame (H4), wait for the FxCOGMaster H Histogram and Yellow SMA line to close below the Oversold line.
- On the higher timeframe (H4), confirm that price is at or near the lower Green FxCOGMaster channel line.
- If the above conditions are met, switch to the lower timeframe (H1).
- On the lower timeframe (H1), wait for FxCOGMaster H Histogram to close above the Yellow SMA Signal line.
- On the lower timeframe (H1), wait for price to close above the 9 SMA on the price chart.
- If the above conditions are met, enter a Buy trade at the open of the next candle.
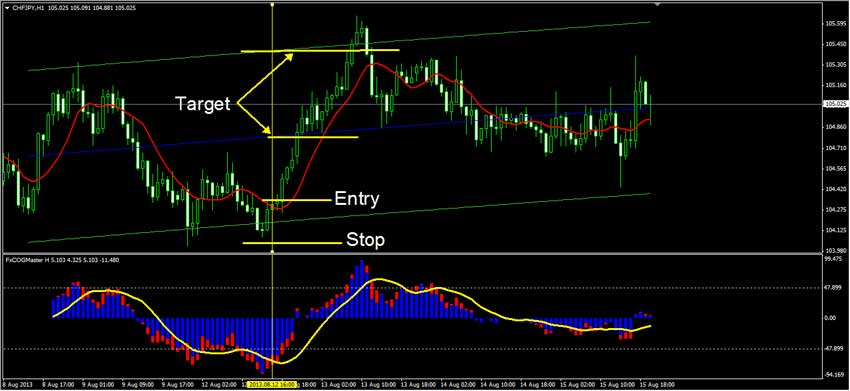
- Set your Stop Loss below the most recent swing low on the lower timeframe (H1).
- Set your Take Profit the same distance away from the entry level as the stop loss (1:1 risk/reward ratio) or exit the trade manually when price touches the Blue middle FxCOGMaster line or the upper Green FxCOGMaster line.
Sell Trade Rules
Below are the rules for placing sell trades:
- On the higher time frame (H4), wait for the FxCOGMaster H Histogram and Yellow SMA signal line to close above the Overbought line.
- On the higher timeframe (H4), confirm that price is at or near the upper Green FxCOGMaster channel line.
- If the above conditions are met, switch to the lower timeframe (H1).
- On the lower timeframe (H1), wait for FxCOGMaster H Histogram to close below the Yellow SMA Signal line.
- On the lower timeframe (H1), wait for price to close below the 9 SMA on the price chart.
- If the above conditions are met, enter a Sell trade at the open of the next candle.
- Set your Stop Loss above the most recent swing high on the lower timeframe (H1).
- Set your Take Profit the same distance away from the entry level as the stop loss (1:1 risk/reward ratio) or exit the trade manually when price touches the Blue middle FxCOGMaster line or the lower Green FxCOGMaster line.
That might seem like a lot of rules but after a few examples I think you’ll get the picture of how this all works so let’s take a look at some charts shall we?
Example Forex COG Trades
1. AUDUSD Sell Trade
Below we have a recent price chart of the AUDUSD on the H4 time frame which lines up pretty well for a good sell trade. This is one of those occasions where things are close and you will run into these quite often.
Take a look at the Yellow vertical line. At this point, notice how the FxCOGMaster H histogram is ABOVE THE OVERBOUGHT LINE and the signal line hasn’t closed above it yet but it is very close. You will also notice that price is near the upper FxCOGMaster channel line.

Now let’s take a look at the H1 chart.
Here we’ve got a great scenario where price is punching through the upper channel line, the histogram is way overbought and so is the signal line. As you can see, two bars later we get our drop below the 9 SMA trigger line.
It’s interesting to note here that as price moved down and hit the bottom FxCOGMaster channel line this happened to be the middle Blue FxCOGMaster line on the 4 hour chart.

2. EURJPY Buy Trade
In our next example, we’ve got a buy trade that worked out famously! Here on the EURJPY H4 chart below, we can see that price is at the lower FxCOGMaster line and the FxCOGMaster H histogram and the signal line have closed below the oversold line. This is the safest most powerful entry we have and really fires off some killer moves!

Next, we’ll drop to the H1 chart and wait for price to close above the 9 SMA. By the time we get our entry, the H4 chart is already in line and we get an extremely powerful move upwards.

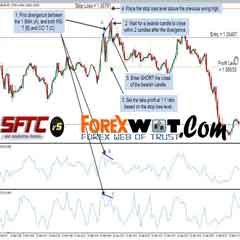
EURUSD Short Trade
Here we’ve got another short trade on the EURUSD H4 chart. This is a text book move just like the previous example. We’ve got the FxCOGMaster H histogram way overbought and price closed outside the upper FxCOGMaster channel line. We can also see the FxCOGMaster H signal line has closed above the overbought line as well.

On the H1 chart, we can see that price was drifting sideways. Once the FxCOGMaster H histogram had touched the overbought line and fell below the signal line, the market was picking up some steam and closed below the 9 SMA and eventually went all the way to the opposite side of the H4 FxCOGMaster channel line.

GBPUSD Short Trade
Here’s another textbook short trade on the GBPUSD. The FxCOGMaster H histogram was above the overbought line and so was the signal line on the H4 chart. Price was also at the upper border of the FxCOGMaster channel line.

So now, we’re good to go to the H1 chart.
Here on the H1 chart, we can see that price was in a range bound market and drifted a bit. The cool thing about this trade was that the FxCOGMaster H histogram peaked at the top of the market where it was waking up for the day.
Once price had its coffee and dropped below the 9 SMA on the price chart, the FxCOGMaster H histogram soon followed and fell below the signal line firing off a very nice move downwards.

This one took a while but it certainly reached the FxCOGMaster center line on the H4 chart and even went beyond to hit the bottom of the FxCOGMaster channel line on the H1 chart before it turned around.
CHFJPY Short Trade
In our last example, we’ve got another great buy trade on the CHFJPY. As we can see below on this H4 chart, the FxCOGMaster H histogram was below the oversold line and formed a little doji at the lower channel line. The signal line was also just barely below the oversold line as well at the close of the doji.

Now we drop to the H1 chart and we can see a much cleaner chart. Price dipped twice below the lower FxCOGMaster channel line and the FxCOGMaster H histogram and signal line have been below the oversold line for quite a while.
At the close of the candle, where the Yellow vertical line marker is, price closed above the 9 SMA and the next candle caused the FxCOGMaster H histogram to move above the signal line. This gave us our entry and POW! What a move!
Trading Strategy Important Notes
We didn’t talk much about money management and stop placement, however, I want to leave you with some personal thoughts regarding those things. As a rule of thumb, don’t risk more than 2-5% of your account on any one trade and only have 1 trade open at a time.
This will reduce the number of losing trades that your account will incur at any one time. Each trade is its own bird so to speak and needs your full attention. You won’t end up having an over-exposed account either.
Imagine having 4-5 open trades at a time with a 5% risk per trade and all of them going bad. That’s a 20-25% loss on your account all at once.
On the flip side, if you only have 1 trade open at a max of 5% risk and it loses then you’ve only lost 5%.
For the stop placement we need to put our stops just beyond the most recent swing low or swing high with a target of 1:1 or better.
In the examples shown, the market moved substantially and it does often, but there are times when it does not so manage your trade properly and be aware that the big ones are right around the corner!
Well, there you have it folks! That is the essence of the FxCOGMaster and the FxCOGMaster H. As a side note, the FxCOGMaster H indicator is probably one of the best overbought/oversold indicators that I’ve seen and I am very happy to present it to you for your trading pleasure, enjoy!
 High Accuracy Forex Center of Gravity Trigger Lines Strategy With Trend Smoothed Indicator
 Foreign Exchange Trading : Online Forex Master Level Trading System and Strategy
 2 MACD Effortless Forex & Stocks Swing Trading Strategy
 MA COBRA Forex & Stocks Trading Strategy (Extremely Low Risk High Reward Trading Strategy) (COBRA SYSTEM)
 FOREX 1 MIN Scalping Trading Tricks By The Most Successful Forex Trader
 5 Minute Chart Surefire RSI-CCI Forex Trading System and Strategy
 H1 Time Frame Trading Strategy: Extremely Low Risk High Reward Forex Cobra Trading
 Forex Forbi EMA-Bollinger Moderate Swing and Trend Trading Strategy
 RSI Momentum Secret Method Forex Trading System – Step by Step Tutorial
 Forex Trend Trading Tricks Of The Successful Forex Trader

Hi, I am currently testing your Fx COG indicators running on MT 4 charts 24 hrs and I found that the FxCOGMaster H indicator is not able to refresh itself; I have to switch the chart timeframes back and forth to refresh the indicator. How do I solve this issue and is it possible to purchase the original indicators ?