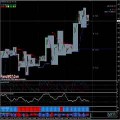
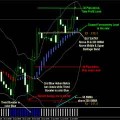
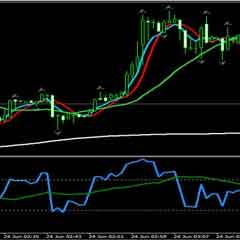
How to use the Aroon Indicator – AROON Indicator is great for reading trends, watch as the “Up Line” (Green color line) reaches 80-100 area means a strong uptrend, and watch for the “Down Line” (Green color line) reaches 20-0 area means a strong downtrend.
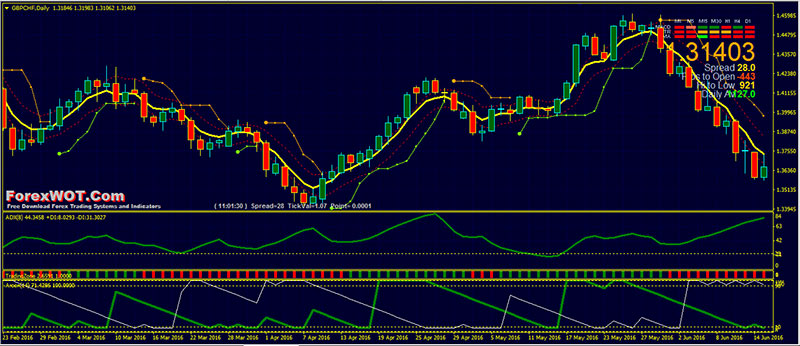
AROON Indicator watches also as they cross each other. It’s great for signaling.
- Interval (Time Frames): 30 minutes or higher
- Aroon Period: 8
Like most oscillators, you can interpret the Aroon indicator readings based on where the Aroon lines are on the chart compared to the value of the corresponding levels it represents.
The key levels you need to watch on the Aroon indicator are 80 and 20.
Would you like to know how to tell if the price is trending up….?
You just have to wait for the Aroon Up line to move above the level 80.
If you find the Aroon Downline is saying below Level 20 at the same time, it would confirm the BULLISH trend in the market.
If you find the Aroon indicator in this situation, you should definitely look to place a buy order based on your trading system rules.
In contrast, if you are about to place a short order because you think the price has broken an important support level, you can use to Aroon indicator to confirm the bearish momentum in the market as well.
As you can imagine by now, in order to confirm a BEARISH trend, the Aroon Down line needs to be below the level 20, and the Aroon Up line should go the opposite way, above level 80.
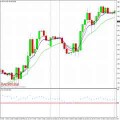
Take a look at the image below.
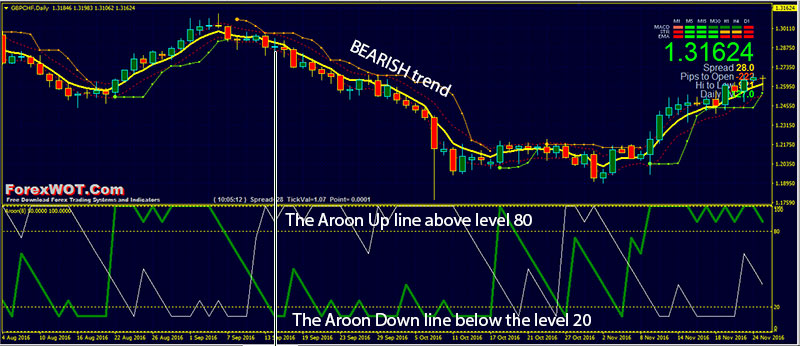
The “Aroon Up” measures how long it has been since prices have recorded a new high within the specified period.
The “Aroon Down” measures how long it has been since prices have recorded a new low within the specified period.
The Aroon indicator is one powerful tool that can be used to determine when a trend in the market is about to happen and can be added to any chart.
- Best Timeframes: M30 or higher
- Most Recommended Currency Pairs: EURUSD, GBPUSD, and all Major Pairs
- Aroon
- Average Directional Movement Index (ADX)
- Traders Zone
- BBands Stops
- Moving Average
- Signal Trend
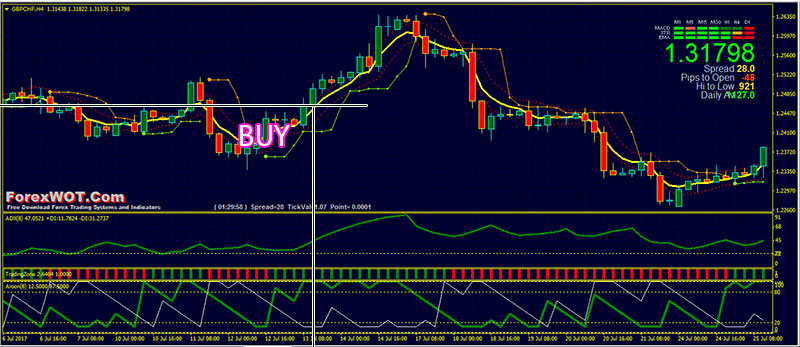
- The Aroon Down line below the level 20, and the Aroon Up line above level 80
- Average Directional Movement Index (ADX) line upward and above level 22
- Traders Zone green color bars
- BBands Stops green color
- Price above the yellow color line of 5 Moving Average
- Signal Trend green color bars
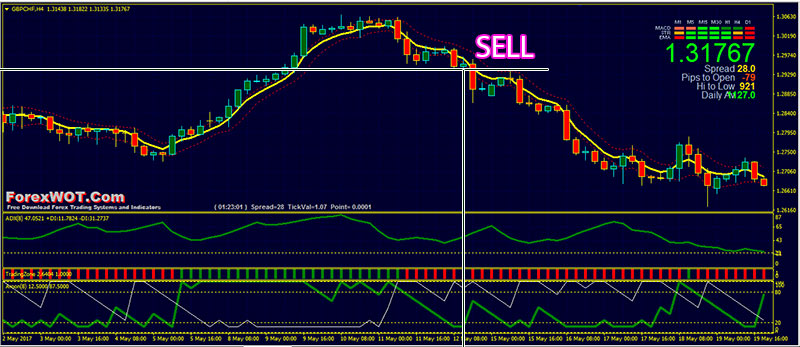
- The Aroon Down line below the level 20, and the Aroon Up line above level 80
- Average Directional Movement Index (ADX) line upward and above level 22
- Traders Zone red color bars
- BBands Stops red color
- Price below the yellow color line of 5 Moving Average
- Signal Trend red color bars
The Aroon indicator is a nifty little tool that you should keep in your day trading arsenal.
It is a visual representation of the price action that you can easily interpret to make your decision about the direction and momentum of the price.
However, you can dramatically increase the odds of making a profitable trade if you implement a trading strategy around the Aroon indicator by combining it with a breakout strategy or any other price action based strategies.


