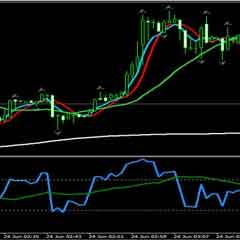
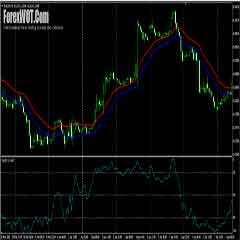
The basic idea behind combining these two tools is to match crossovers. In other words, if one of the indicators has a cross, we wait for a cross in the same direction by the other indicator. When this happens, we buy or sell the equity.
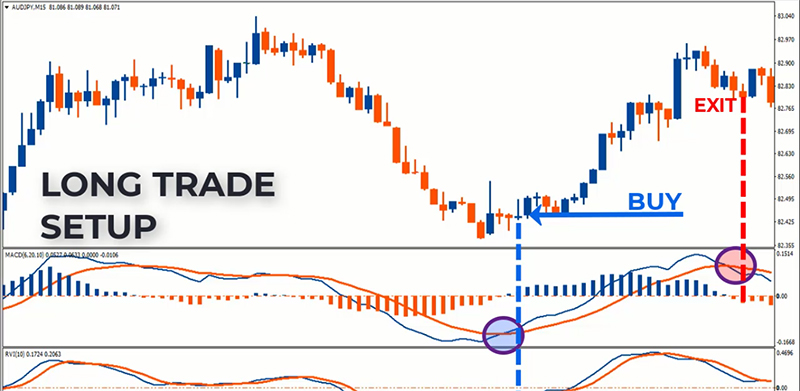
- MACD crosses above its Signal Line
- RVI crosses above its Signal Line
EXIT Rules
- We hold until the MACD line crosses below its Signal Line
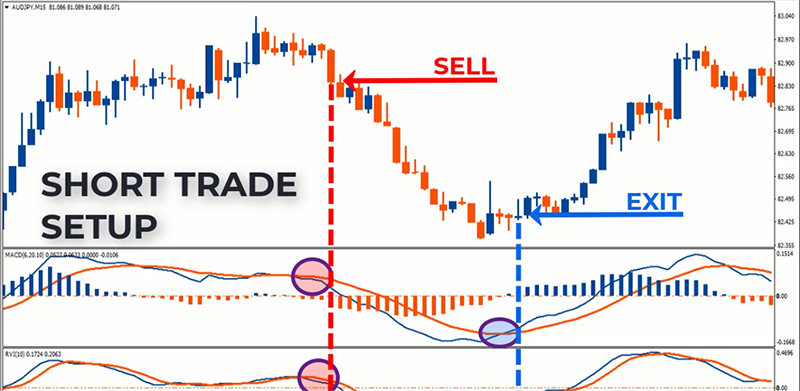
- The MACD line crosses below its Signal Line
- The RVI line crosses below its Signal Line
EXIT Rules
- To manage the position, we hold until the MACD line crosses above its Signal Line
![]()
You’ll learn to Implement the MACD Divergence Indicator much more Effectively. This is one of the most powerful trading strategies to use.
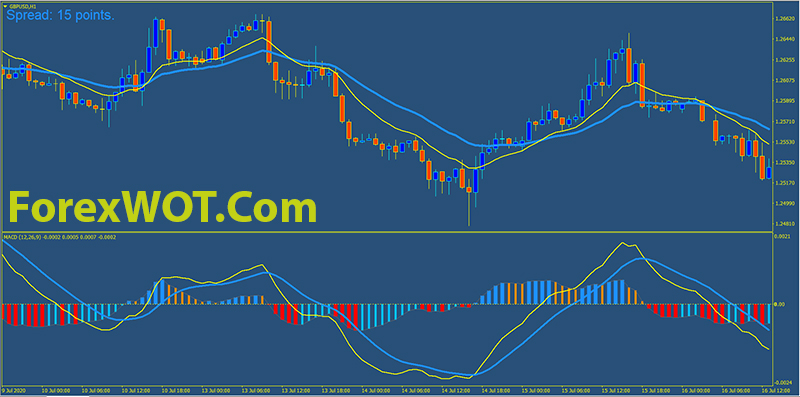
You can use the MACD histogram to search for divergences, but also the MACD line and the signal line. The strongest signals appear when there is a double divergence, on both the histogram and on the signal and MACD line.
This is my favorite way to use the MACD, and the most effective way. Trading MACD divergence, if done correctly, can provide you with a real edge in the market. It can be a powerful early indicator of trend reversals when combined with price action.
![]()


