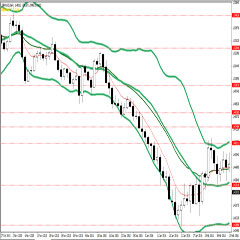
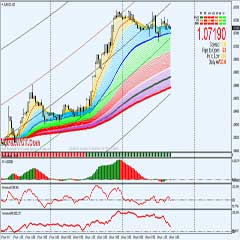
DOWNLOAD BBMACD Trading System – Bollinger Bands® consist of a center line and two price channels (bands) above and below it. The center line is an exponential moving average; the price channels are the standard deviations of the stock being studied. The bands will expand and contract as the price action of an issue becomes volatile (expansion) or becomes bound into a tight trading pattern (contraction).
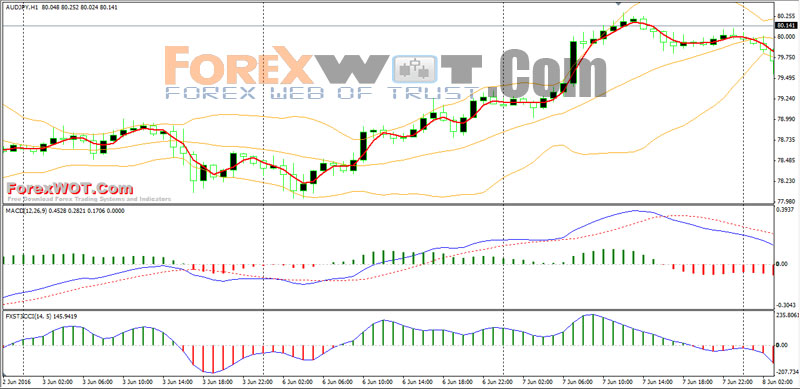
At the core, Bollinger Bands® measure and depict the deviation or volatility of the price. This is the reason why they can be very helpful in identifying a trend. Using two sets of Bollinger Bands® – one generated using the parameter of “1 standard deviation” and the other using the typical setting of “2 standard deviation” – can help us look at price in a different way.
This technique is for those who want the most simple method that is almost fool-proof. It must be done only during the busiest trading hours, 3 am to 11 am EST. This method doesn’t work in sideways markets, only in volatile trending markets.
If your plattafom does not have if your platform does not have chaos Chaos Awesome Oscillator (a colored Macd Histogram), and you would need to switch to CMS to have use of the Chaos.
Indicators:
- EMA 3 period color red
- FX SIPER (T3-CCI)
- Bollinger Bands 20 period 20 deviation 3
- Chaos Awesome Oscillator (Colored MACD Histogram).
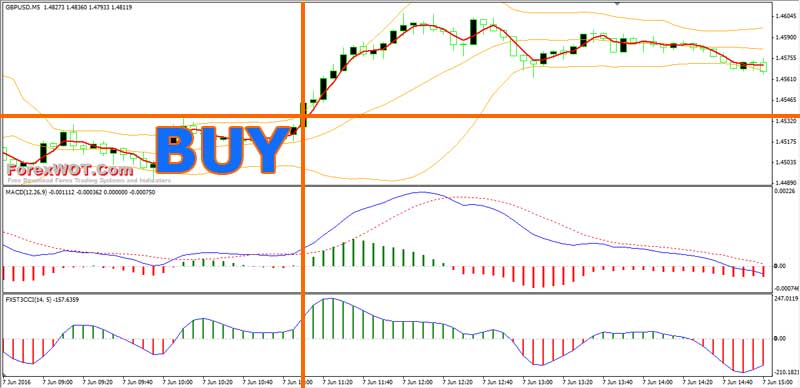
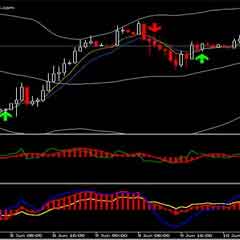
- Red 3 EMA has crossed up through the middle band
- at the same time, the Chaos Awesome Oscillator (Colored MACD Histogram) should be approaching or crossing it’s zero line and upward
- FX SIPER (T3-CCI) green color
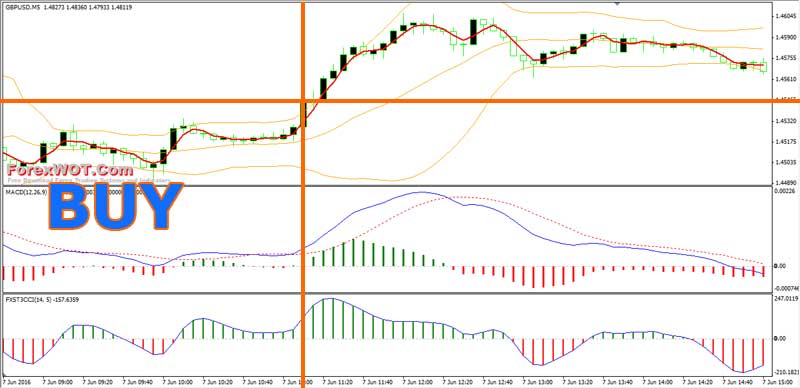
- Red 3 EMA has crossed down through the middle band
- at the same time, the Chaos Awesome Oscillator (Colored MACD Histogram) should be approaching or crossing it’s zero line and downward
- FX SIPER (T3-CCI) green color
This technique is for those who want the most simple method that is almost fool-proof. It must be done only during the busiest trading hours, 3 am to 11 am EST. This method doesn’t work in sideways markets, only in volatile trending markets.


