“Forex SWING TRADING SYSTEM” System is mainly a trend-momentum following system designed for trading forex market. The methods used with this system are powerful and effective.

DEFINITION of ‘Swing Trading’– A style of trading that attempts to capture gains in a stock within one to four days. Swing traders use technical analysis to look for stocks with short-term price momentum. In stock market, these traders aren’t interested in the fundamental or intrinsic value of stocks, but rather in their price trends and patterns.
This Forex SWING TRADING SYSTEM is using different indicators to identify the major trend and show you the best entry/exit points. The system is also equipped with powerful support and resistance indicators that we’ll be using to place stop loss and targets.
Time Frame: H1 or higher.
Currency pairs: Any.
1 – Stoch Candles ( Based on Stochastic indicator )
Blue Candles = Up trend, Buy Signal. Red Candles = Down trend, Sell Signal.
2 – Trend Filter2 ( Based on Moving Averages )
Blue Bars= Up trend, Buy Signal. Red Bars = Down trend, Sell Signal. This indicator will also be used for trend reversal alerts generated by Divergence signals.
3 – Smothed HA ( Based on Heikin Ashi )
This indicator works as a trend indicator that shows the direction of the trend, and also works as a trend power detector that allows you to know if the trend is powerful enough or not.
Blue Candles = Powerful Up Trend = Buy Signal
Red Candles = Powerful Down Trend = Sell Signal
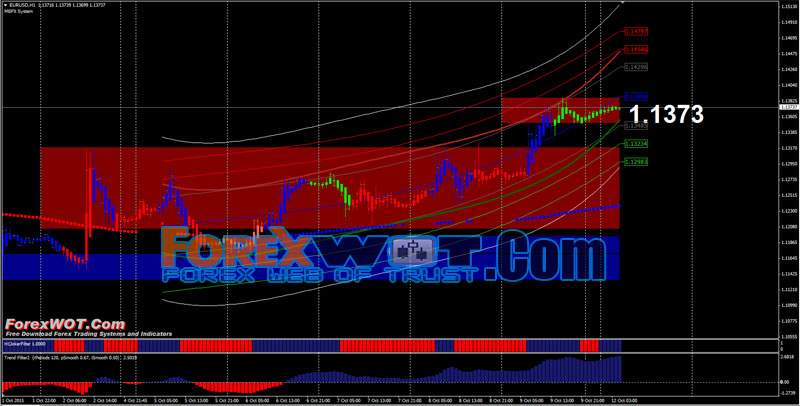
4 – Support And Resistance Indicators
The First indicator shows the most powerful support and resistance LEVELS. Blue dots = support/resistance, Red dots = powerful supports and resistance levels.
We’re going to use this indicator for stops and targets.
The second indicator shows major support and resistance AREAS.
This indicator will be used mainly for Targets.
5 – Trend Channel indicator is simply a visual trend identifier ). It provides visual confirmation for the rest of indicators used to identify the major trend.
It doesn’t provide buy/sell signals but it provides overbought and oversold areas – between red lines.
Red lines = Overbought = Possible Reversal
Green Lines = Oversold = Possible Reversal
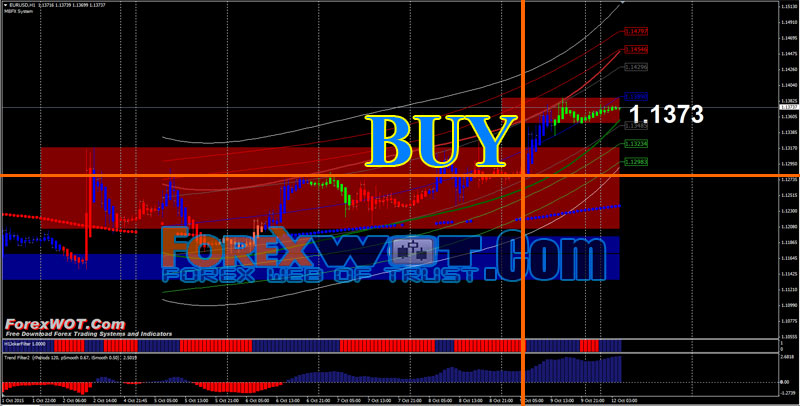
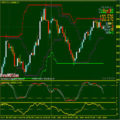
Last indicator that we’re going to use is the one that will show us the best entry/exit points…
- Blue Candles
- Trend Filter = Blue Bars
- Trend Channel (Polynomial Regrssion) = Up Trend
- ADX MA = Blue Dots
- Smooth HA = Blue candles
- Jocker Filter = Blue Bar
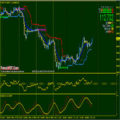
- Red Candles
- Trend Filter = Red Bars
- Trend Channel (Polynomial Regrssion) = Down Trend
- ADX MA = Red Dots
- Smooth HA = Red candles
- Jocker Filter = Red Bar
For stops and targets we’re going to use the support/resistance levels/areas indicators or bands of the polynomial regression.
 How Do I Become a Good and Prifitable Forex Trader
 High Accuracy Volty Channel Stop RSI Trading Strategy and How to Win Consistently in Forex Trading
 Forex Bill Williams Market Facilitation Index (BW MFI) Multi Trend Trading System and Strategy
 High Probability Trading: The 10 Pips Forex Trading Strategy
 Best Forex & Stocks Trading Strategy with Dolly-Graphics System
 Forex and Crypto “MORNING TRADE” Trading Strategy for Advanced Traders
 EASY Forex H1 IntraDay Trading System With Bill Williams Alligator Multi Trend Signal
 High Profit Simplified Donchian Channels Turtle Trading System
 10-5 Turtle Channel Daily Intraday Trading Strategy
 Is $500 Sufficient to Start Forex Trading
