How to Measure FOREX Market Sentiment – The mood of the market depends mainly on what the majority of traders think about the current market situation. But how can you get an idea of the overall sentiment of the market…? You can do so by reading reports by analysts and financial journalists in news wires or by visiting online trading forums to see what other traders are discussing.
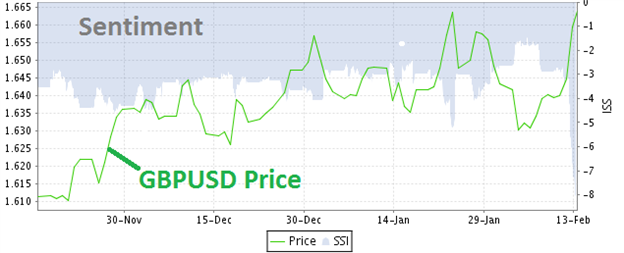
However, these ways of getting a feel of the current market sentiment are not too accurate; you may think that other traders are in a buying or selling mood, but that may not be what is really happening in reality. Here are some of the more effective ways of gauging market sentiment:
- The Commitment of Traders (COT) report
- The market’s reactions to news releases
These are explained in more details below.
The COT report provides traders with detailed positioning information about the futures market, and is, in my opinion, one of the most underrated tools that forex traders can make use of to enhance their trading performance.
The report is compiled and released weekly by the Commodity Futures Trading Commission (CFTC) in the United States every Friday at 15:30 Eastern Time, and records open interest information about the futures market based on the previous Tuesday. Anyone can access the COT report for free on the CFTC website
(www.cftc.gov/cftc/cftccotreports.htm).
There are basically two types of reports available: the futures-only COT report and the futures-and-options-combined COT report. I usually just access the futuresonly report for a glimpse of what has happened in the futures dimension of the forex market. In order to get through to the currency futures data, you have to wade past other commodities like milk, feeder cattle and so on, so a little patience is required.
Even though the data arrives three days late, the information nonetheless can be helpful since many traders spend their weekend analyzing the COT report. The time lag between reporting and release is the main handicap of the COT data, but despite this limitation, you can still use it as a sentiment tool.
Figure below shows a page from the December 19, 2006, COT report (short format), displaying data for the Chicago Mercantile Exchange’s Euro FX futures contract. You can see the long and short positions held by traders in each of the three main categories defined by the CFTC, as explained below.

Some notes to the figure above.
- CommercialThis group consists of market participants who use the futures contracts for hedging purposes, and these commercial participants are generally exporters andimporters who are hedging against currency fluctuations. For example, a German car-maker, who exports to the US, expects to receive 10 million euros worth of sales within the next quarter. To hedge against the possibility of a US dollar decline which would affect the amount of euros it would receive once converted, the German car-maker would short 10 million in Euro FX futures. On the other hand, if a US car manufacturer exports 10 million US dollars worth of cars withinthe next quarter, it would long the equivalent in Euro FX futures contracts.
- Non-commercial
This group consists of large speculators such as hedge funds, banks and so on who use currency futures just for speculation. - Non-reportable
This group consists of small speculators like retail traders.
The COT report tells you the long and short positions undertaken by participants from each category. When it comes to analyzing information pertaining to currency futures in the COT report, it is generally more relevant for traders to focus on the noncommercial participants rather than on the commercial participants.
The reason behind this is that these large speculators trade the futures contractsmainly for profits, and do not have the intention to take delivery of the underlying asset, which in this case would be cash.
On the other hand, commercial participants tend to maintain and roll over the same amount of contracts from month to month for hedging purposes even though these positions could be in losses. Large speculators, however, will usually close their losing positions instead of rolling them over to the next month.
The COT report allows you to gauge market sentiment in the currency futures market, which also influences the spot forex market. Currency futures are basically spot prices which are adjusted by the forwards (derived by interest rate differentials) to arrive at a future delivery price.
Unlike spot forex which does not have a centralised exchange at the time of writing, currency futures are cleared at the Chicago Mercantile Exchange.
Price Quotation
One of the many differences between spot forex and currency futures lies in their quoting convention. In the currency futures market, currency futures are mostly quoted as the foreign currency directly against the US dollar.
Free Download Forex Trading Systems:
For example, Swiss francs are quoted versus the US dollar in futures, unlike the USD/CHF notation in the spot forex market. So if the Swiss franc falls in value against the US dollar, USD/CHF will rise, and the Swiss franc futures will fall. On the other hand, EUR/USD in spot forex is quoted in the same way as Euro futures, so if the Euro appreciates in value, Euro futures will rise just like EUR/USD will go up.
That said, spot forex and currency futures do have one similarity: the spot and futures prices of a currency tend to move in tandem.When either the spot or futures price of a currency rises, the other also tends to rise, and when either falls, the other also tends to fall.
For example, if the GBP futures price goes up, spot GBP/USD goes up (because GBP gains in strength). However, if the CHF futures price goes up, spot USD/CHF goes down (because CHF gains in strength), as both the spot and futures prices of CHF move in tandem.
In the COT report, under each type of currency futures, you can see that the total contract volume in each category is split up between “long”, “short” and “spreads”, of which the first two are relevant to our analysis. What is of concern to us is whether the non-commercials are net long or short in that currency futures.
In order to determine the volume of contracts that these large speculators are holding net long or short positions of for that particular currency futures, you just need to calculate the difference between the longs and shorts, that is, subtract the number of short contracts from the number of long contracts.
A positive figure shows the number of net long contracts, while a negative figure shows the number of net short contracts.
As you can see in Figure below, the open interest for GBP futures on Tuesday December 19, 2006, was 149,800 contracts which was a decrease of 31,780 contracts from the previous week. The non-commercials are long 98,434 contracts and short 12,836 contracts. Therefore, they are overall net long 85,598 contracts (98434 – 12836).

Usually, when a particular currency is trending up against the US dollar, the noncommercials tend to register a net long position since these large speculators tend to ride on the existing trend. The opposite situation is true too: the non-commercials tend to register a net short position when a particular currency is trending down against the US dollar.
Knowing whether this category has been net long or short a few days ago only indicates to us the positioning in retrospect; this information is only useful if you compare the latest net positioning with the positioning figures from the past few weeks or months.
By comparing the latest net positioning with that of the past few weeks or months, you can tell if the latest net long or net short positioning is skewing towards an extreme reading.
My observation of the financial markets is that dramatic price moves, usually at major turning points, tend to occur when the majority of the market is positioned incorrectly. And since the large speculators are more inclined to close their losing positions than the commercial hedgers, it is beneficial for us to keep an eye on their net directional positioning as well as their net contract volume in the currency futures market.
If these large non-commercials are positioned on the wrong side of the market, you can expect liquidation of these positions, with the extent of liquidation depending on the total volume of contracts traded in the wrong direction.
For example, if these large funds are holding large (extreme) net long GBP positions, but GBP is declining against the US dollar due to some external catalysts like news, they will eventually have to close their longs when their stops are triggered, or decide to close their longs before getting stopped out and switch to
shorting GBP on the way down.
Such mass unwinding of positions tends to bring about a powerful price move in the opposite direction which could last for a few days, and it is this turning point that you could detect with the COT data before the reversal scene actually plays out.
Example: COT – using extreme position
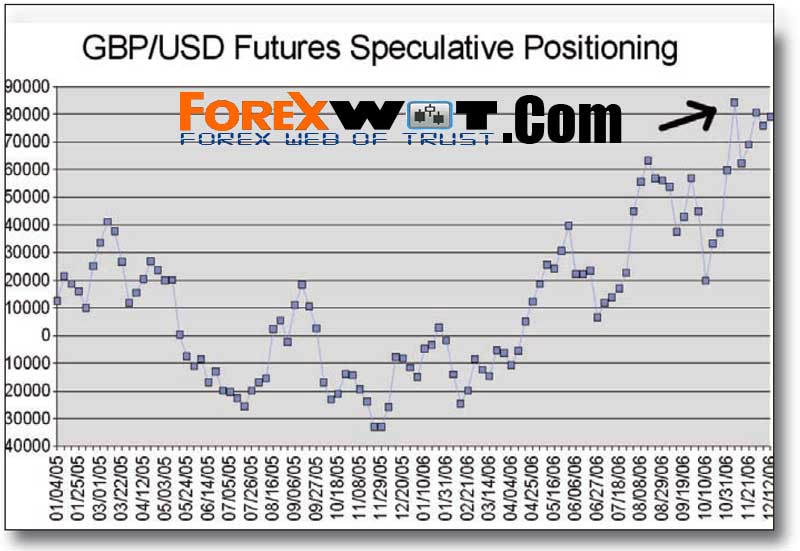
An example of this was played out in the week through November 13-17, 2006. The COT report that was released on November 10 showed that, as of the previous Tuesday on November 7, large speculative funds upped their net GBP longs to a multi-year high of +84,280 contracts, a figure which clearly shows up as an extreme
positioning on the chart as shown in Figure below.
In this case, all those who had the intention to go long on GBP had already done so. As a result of this extreme net speculative positioning of GBP longs on the CME, GBP/USD in the spot market proceeded to decline by more than 300 pips in the following week through November 13-17, 2006 (Figure below).
This chart shows the net speculative (non-commercial) positions in GBP futures on the CME. X-axis displays the dates for every three weeks even though the data for every week is shown on the chart. Y-axis displays the net number of speculative contracts. Positive numbers indicate net long positioning, while negative numbers indicate net short positioning.
In the week following the extreme net long speculative positioning, reflected by the COT data, GBP/USD fell by 310 pips as seen on this 60-min chart.
The presence of an extreme reading allows you to be prepared for a possible trend reversal which could occur when large speculators liquidate their positions. Amere increase or decrease of contracts for a particular currency futures does not indicate anything which could be of predictive value, as it simply shows you what has happened, but not what could possibly happen in a high-probability scenario.
What deters many traders from using the COT report is its raw organisation of data, but that is not good enough an excuse to completely neglect this little treasure trove. The information from the COT report can be transferred into a spreadsheet so that further analysis can be conducted in a more suitable format.
The COT data itself is not sufficient to generate entry or exit signals, as the report does not consist of currency price data, but it can generate warning signals of a possible turn ahead in the spot forex market, and can be used to optimise other trading strategies you may have so that maximum profits can be reaped from the market.
Analysis of the COT report does not always throw up trading opportunities in the spot forex market, but when it does, you will be better prepared for a potential turn of tide, and be more confident in your trades. Even though entries and exits cannot be timed solely based on the COT data, it can be an extremely useful tool to have in your toolbox to gauge the overall market sentiment.
Another way for traders to gauge the market sentiment is by analyzing how the market responds to unanticipated news.
The forex market is very efficient at discounting future expectations by incorporating them into current prices. Very often, when news comes out better than is expected by economists and analysts, the currency of that country is more likely to soar against another currency.When the news is worse than expected, that currency is more likely to fall against another currency.
However, if the news or data turn out to be worse than expected and still the currency price soars, that is, the market reacts in a very bullish way to worse than expected data, a bright red flag should be waving at you.
The opposite situation also applies: if price action remains very bearish to much better than expected news, it signals a highly suspect price move.
In short, you should look out for a contrarian market reaction to better or worse than expected news. Under these circumstances, it is better to assume that the price move is hardly supported by substance, and could reverse sometime soon.
A bullish price move that is not accompanied by evidence will soon be due for a reality check, just like a bearish price move that is not accompanied by evidence is very likely to be corrected very soon.
If you day trade the forex market, you may judge the market’s reaction based on one piece of news, but if you position trade, monitor the market’s reactions to several news to see if the responses are still contrary.
For example, if a piece of news turns out to be worse than expected, and assuming that there are no pre-release rumours or leaks of the news, and the currency pair rallies to break above a significant resistance level, you have reasons to suspect that the breakout move is likely to be false and unsustainable.
Even if the currency pair manages to make new highs later on, you should be prepared for a possible trend reversal very soon. Monitoring the market’s reactions to news can enable traders to identify corrective moves in the forex market.
Not all news items get the same amount of attention from big market players; news relating to the job or housing market usually get more attention. The relative significance of news will vary from time to time.
Summary
As you have seen, market sentiment can be used, and should be used, to time your trade and identify profitable trading conditions. The Market Sentiment Strategy has to be applied in conjunction with other strategies as it does not have precise entry and exit signals.
By making use of information on the net speculative positioning of currency futures and by observing the market’s reactions to news, you will be better equipped to gauge the market sentiment and will be able to use that extra edge to help you see what is actually happening or is going to happen in the spotforex market.
Once you get a sense of the current market sentiment, you can then decide whether it is best to trade with or against the sentiment, taking into accountall other factors.
While it may be sensible to trade in the direction of the current sentiment, sometimes, trading against the sentiment can also be a profitable strategy, provided that you have valid reasons to do so. For example, when the COT report indicates extreme positioning of the market, or when the market seems to be feeding off false euphoria on worse than expected news, it may be better to trade against the overall sentiment.
You should, however, wait for a more precise signal that the current sentiment is wearing off before going against it, as sometimes false euphoria can last for quite some time before resulting in a reversal. This signal could be a failed breakout of some sort or some other pattern failure.
Always keep in mind that currency prices are, after all, the expressed perceptions of traders and market sentiment is really the blood that drives the market on the whole.
Using the Market Sentiment Strategy can help you identify the “what” (whether to go long or short of a currency); while technical analysis shows you the “when” by helping to pinpoint the price you should enter or exit your positions.


