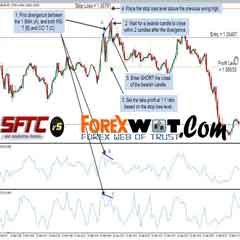
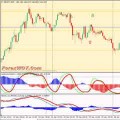
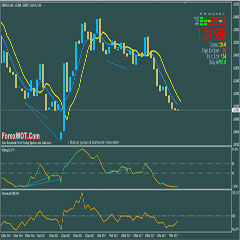
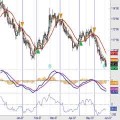
The purpose of classic divergence is to recognize a technical imbalance between price and oscillator, with the assumption that this imbalance will signal an impending directional change in price.

The word divergence itself means to separate and that is exactly what we are looking for today. Typically Oscillators such as MACD will follow price as the USDJPY declines. So when the USDJPY goes lower, usually so will the indicator. Divergence occurs when price splits from the indicator and they begin heading in two different directions. In the example below, we can again see the USDJPY daily chart with MACD doing just that.
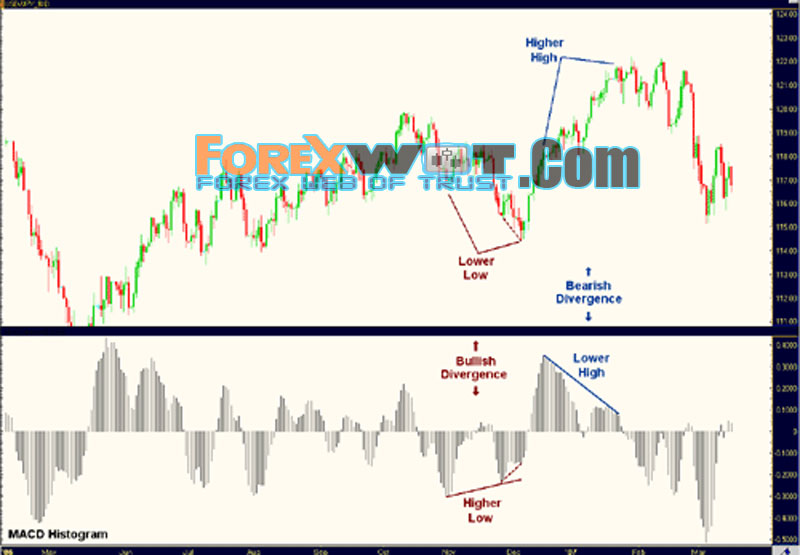
So how can we best maximize the profit potential of a divergence trade while minimizing its risks? First of all, although divergence signals may work on all timeframes, longer-term charts (daily and higher) usually provide better signals.
As for entries, once you find a high-probability trading opportunity on an oscillator divergence, you can scale into position using fractionally-sized trades. This allows you to avoid an overly large commitment if the divergence signal immediately turns out to be false. If a false signal is indeed the case, stop-losses are always firmly in place – not so tight that you get taken out by minor whipsaws, but also not so loose that the beneficial risk/reward ratio will be skewed.
If the trade becomes favorable, on the other hand, you can continue to scale in until your intended trade size is reached. If momentum continues beyond that, you should hold the position until momentum slows or anything larger than a normal pullback occurs. At the point that momentum wanes, you then scale out of the position by taking progressive profits on your fractional trades.
If a choppy, directionless market is prolonged, as in the case of the second divergence signal that was described above on USD/JPY, it should prompt you to cut your risk and go hunting for a better divergence trade.
So what can we learn from all of this? It is pretty safe to say that there is at least some validity to oscillator divergence signals, at least in the foreign exchange market. If you look at the recent history of the major currency pairs, you will see numerous similar signals on longer-term charts (like the daily), that can provide concrete evidence that divergence signals are often exceptionally useful.
The Best Time Frame is D1. Now it’s time to put those Jedi divergence mind tricks to work and force the markets to give you some pips!
Here we’ll show you some examples of when there was divergence between price and oscillator movements.
First up, let’s take a look at regular divergence. Below is a daily chart of USD/CHF.
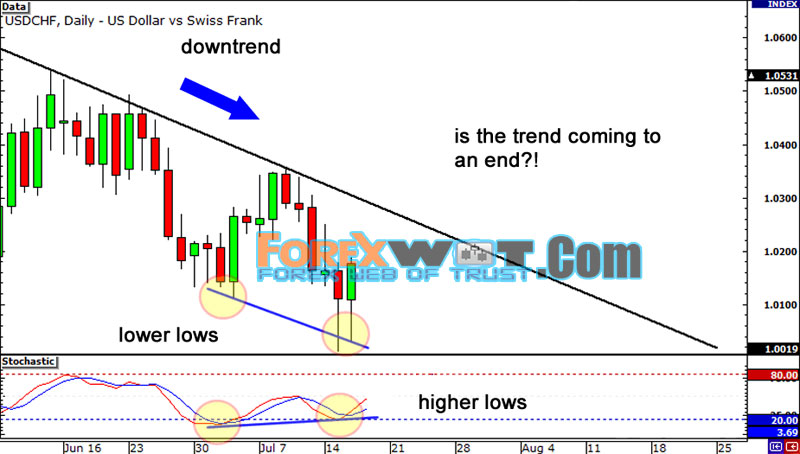
We can see from the falling trend line that USD/CHF has been in a downtrend. However, there are signs that the downtrend will be coming to an end.
While price has registered lower lows, the stochastic (our indicator of choice) is showing a higher low.
Something smells fishy here. Is the reversal coming to an end? Is it time to buy this sucker?
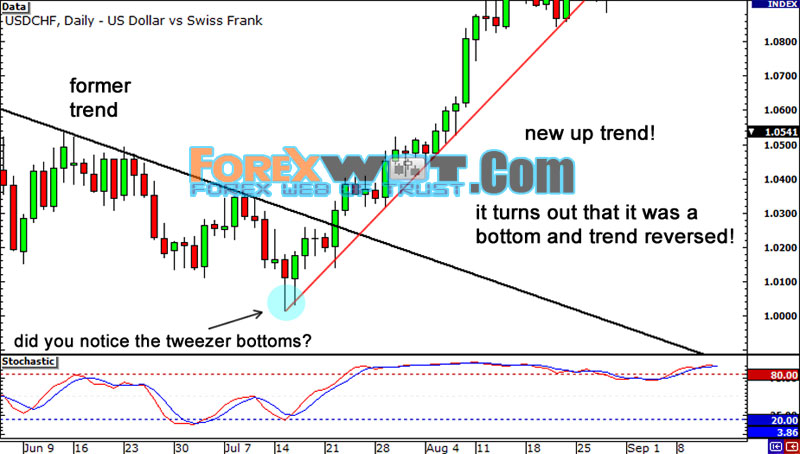
If you had answered yes to that last question, then you would have found yourself in the middle of the Caribbean, soaking up margaritas, as you would have been knee deep in your pip winnings!
It turns out that the divergence between the stochastic and price action was a good signal to buy. Price broke through the falling trend line and formed a new uptrend. If you had bought near the bottom, you could have made more than a thousand pips, as the pair continued to shoot even higher in the following months.
Now can you see why it rocks to get in on the trend early?!
Before we move on, did you notice the tweezer bottoms that formed on the second low?
Keep an eye out for other clues that a reversal is in place. This will give you more confirmation that a trend is coming to an end, giving you even more reason to believe in the power of divergences!


