How To Draw and Use Trendlines – Trend lines have become widely popular as a way to identify possible support or resistance. But one question still lingers among Forex traders – how to draw trend lines perfectly?
Trendlines are very useful in helping you determine the trend, and also the strength of that trend as well. Today we are going to take a closer look at this important price action analysis technique.
As the name implies, trend lines are levels used in technical analysis that can be drawn along a trend to represent either support or resistance, depending on the direction of the trend.
Think of them as the diagonal equivalent of horizontal support and resistance.
Trendlines are a great place to start. All you have to do is identify trends on a chart, draw your trendlines and then watch how the price interacts with them.
These trend lines can help us to identify potential areas of increased supply and demand, which can cause the market to move down or up respectively.
In this article we will look at:
- How to draw trendlines
- How to use trendlines in your trading
To draw forex trend lines perfectly, all you have to do is locate two major tops or bottoms and connect them.
What’s next?
Nothing.
Uhh, is that it?
Yep, it’s that simple.
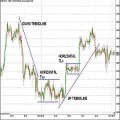
Let’s take a look at a trend line that was drawn during an uptrend.
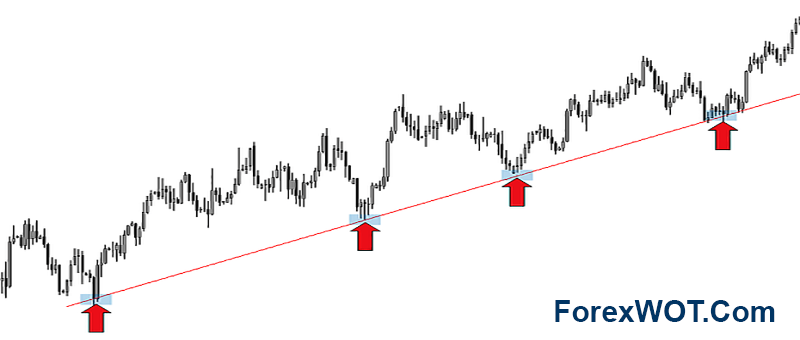
Notice how in the chart above, the market touched off of trend line support several times over an extended period of time.
In this manner, the price of the pair records higher bottoms and higher tops.
This trend line represented an area of support where traders can begin to look for buying opportunities.
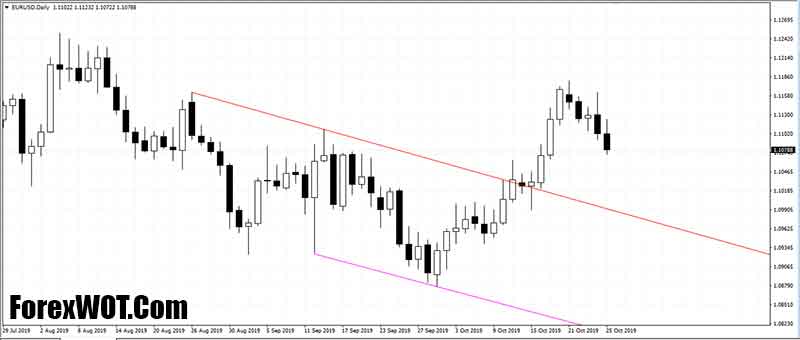
Now let’s take a look at a trend line that was drawn during a downtrend.
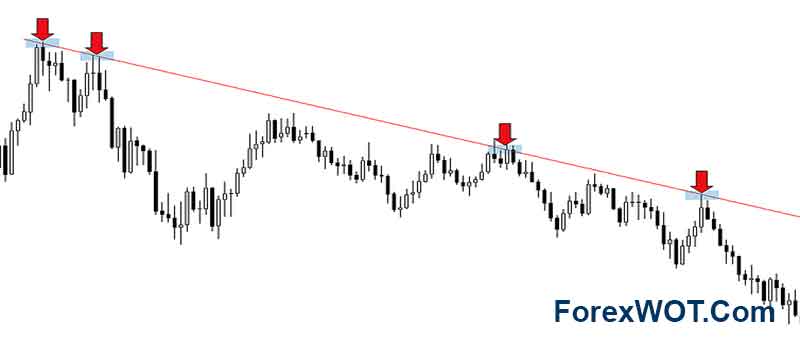
Notice how in the chart above, the market touched off of trend line resistance several times over an extended period of time.
In this manner, the price of the pair records lower bottoms and lower tops.
This trend line represented an area of resistance where traders can begin to look for selling opportunities.
Let’s Draw Trendlines
In order to draw a trendline (bearish or bullish), you first need to identify a trend. So, let’s have a look at a chart.
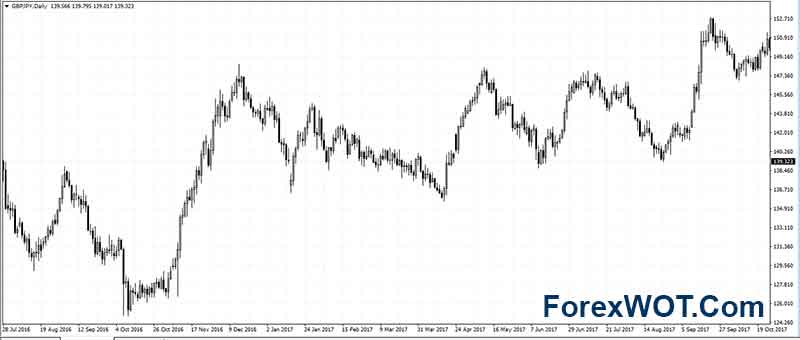
Can you find a trend in the chart above?
It’s hard to do so visually without the help of a trendline. But once we add our trendline to the chart, you can see that there are at least six minor trends here.
The very first thing to know about drawing trend lines is that you need at least two points in the market to start a trend line. Once the second swing high or low has been identified, you can draw your trend line.
Let’s look below.
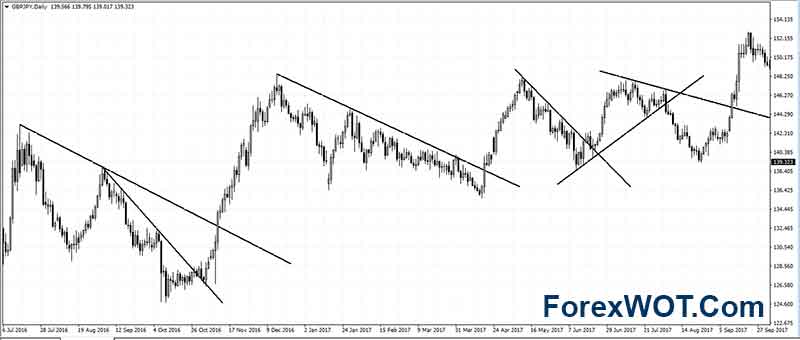
Notice in the chart above, we have two main points at which we can start to draw our trend line. Once this level has been established, we can start to look for bearish or bullish price action to join the rally.
The question is whether you should use the candle-wicks or the candle-bodies to draw the trendlines!?
The answer is CONFLUENCE.
NOTE: Never think of the trend as contained within of a single line. The trend is not a line, but an area.
Whenever you get the best and the most contact points and confluence around your trendline, that’s how you draw it.
There are no fixed rules about whether wicks or bodies are better.
Just look for a trendline that gives you the most confirmation without beeing violated too much. Having said that, I don’t mind violations of just candle wicks as much as of candle bodies.
Now I will show you how to spot and trade corrections of trending moves.
However, I would like to emphasize that counter-trend trading is for advanced traders. The reason for this is that it is a risky initiative to trade corrections.
We can get the following information from trendlines:
- Is a trend losing or gaining strength? (The trendline angle tells us that)
- Trendlines can be support and resistance
- A break of a trendline after a trending period can be a meaningful signal
One thing to note about using trend lines in this way is that it works best when you have a really clean trend line with three or more touches.
The more obvious the trend line is, the better this strategy will work.
Let’s look below.
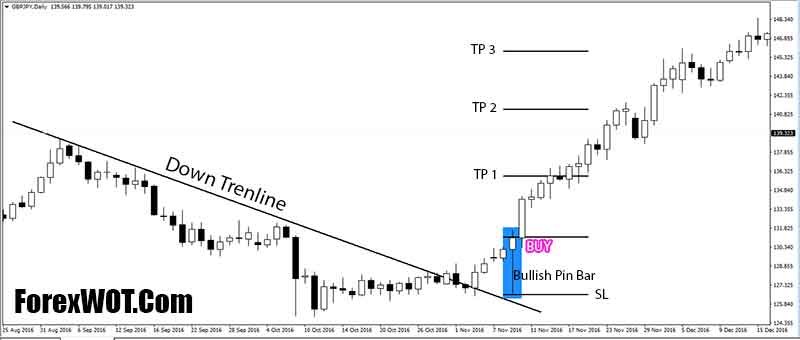
Notice how shortly after breaking trend line resistance, the market came back to retest the trend line as new support and formed a bullish pin bar in the process.
This gave price action traders an opportunity to buy.
This is a great way to use trend lines to spot potential reversals in the market. It is without a doubt one of the best ways to catch a big move as a market changes direction.
- Never try to force a trend line to fit – if it doesn’t fit the chart then it isn’t valid and is therefore not worth having on your chart.
- The more touches the trendline has, the more important it is.


