Highly effective Forex Trading System – Best Collaboration of Forex Fisher Lambic and FPH Oscillator Trading Indicator to Maximize the Results of a Trade. The trading strategy is based on Fisher Lambic and FPH Oscillator.
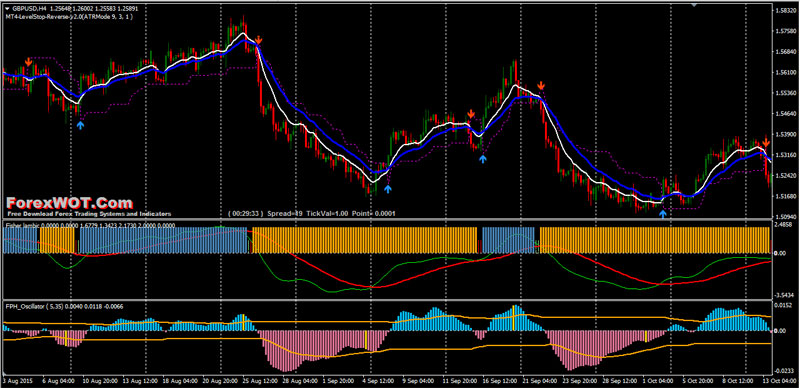
MT4 LevelStop indicator or Average True Range Trailing stops are more adaptive to varying market conditions than Percentage Trailing Stops, but achieve similar results when applied to stocks and currency market that have been filtered for a strong trend.
MOVING AVERAGE : A widely used indicator in technical analysis that helps smooth out price action by filtering out the “noise” from random price fluctuations. A moving average (MA) is a trend-following or lagging indicator because it is based on past prices.
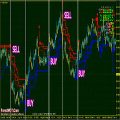
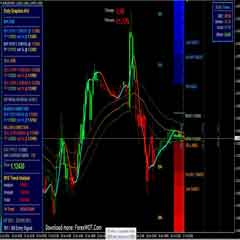
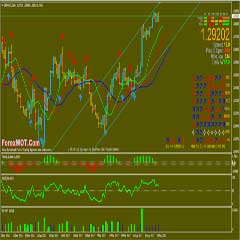
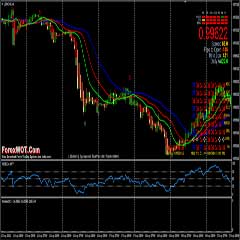
Forex Fisher Lambic and FPH Oscillator Trading Rules
Fisher Lambic indicator it ‘s a repaint indicator because based on Fisher transfer function but it’s is checked by your MA crossover and FPH Oscillator indicator in sub window.
BUY Rules
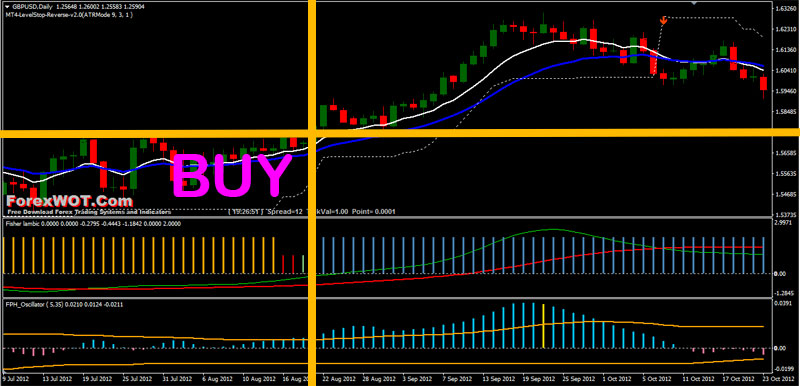
- Fisher Lambic Histogram Blue
- Fisher Lambic Line upward, (green line above red lina)
- FPH Oscillator histogram Blue and above linesidentifier
- MA 10 upward above MA 20
- MA 20 and MA 10 above MT4 LevelStop indicator
SELL Rules
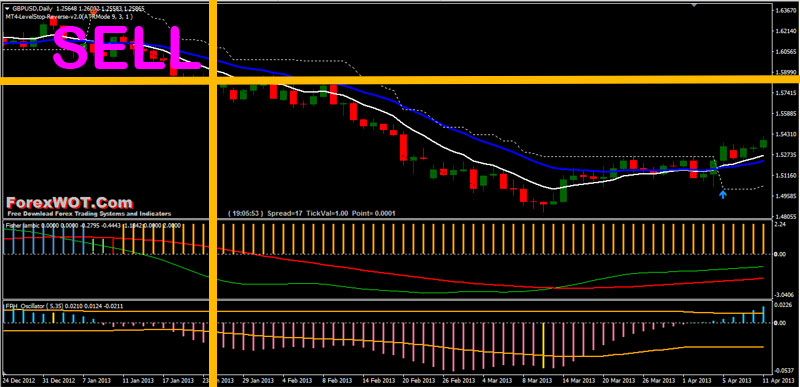
- Fisher Lambic Histogram Orange
- Fisher Lambic Line downward, (green line below red lina)
- FPH Oscillator histogram Orange and below linesidentifier
- MA 10 downward below MA 20
- MA 20 and MA 10 below MT4 LevelStop indicator
NOTE:
MT4 LevelStop indicator or Average True Range (ATR) is usually used to set trailing stops to close positions based on average true range. Not commonly used to open positions.
ATR Trailing Stop in a rising trend is highest price over the user-defined span minus (multiplier * ATR). If prices continue to rise, the stop will continue to rise. However, if prices flatten out or pull back the stop will be flat. Only when price dips below the flat stop line will it flip to the inverse with the stop above prices.



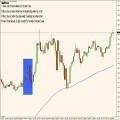
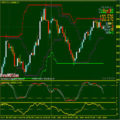
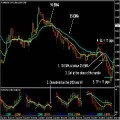
Honestly the best system up here.
You will win trades with ease.
I just use the FPH Oscillator, which I buy or sell in the direction of where the yellow bar was shown and close out my position when the next yellow bar is shown and buy or sell afterward.
My entry for a trade on the oscillator is first seen a yellow bar then when the line crosses the macd where there is an open space I take the trade. That concept is similar to an essam indicator but accurate and efficient since it really helps your trades.
Try it on demo first.
I trade on a 5min time frame and I’m sure it will work on others as well.