This system is designed for longer time frames, it’s a trend following system that just ride the trend to the maximum profit, you can use shorter time frames but you will be exposed to more market noise, this system works perfectly in H4 and D1 time frame.
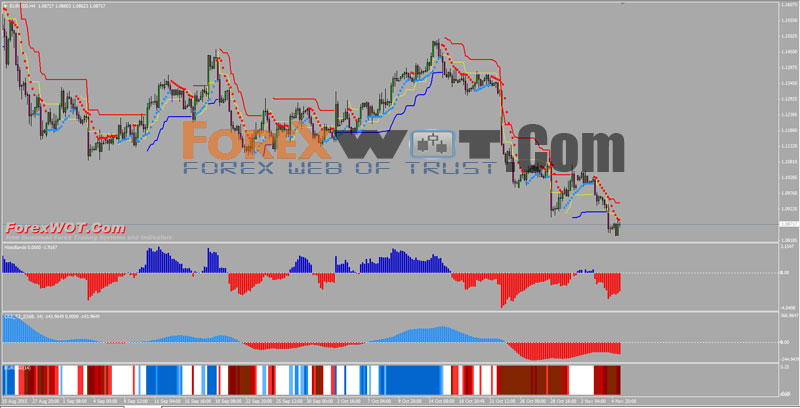
This system is made of two basic functions:
- Determining the actual trend (The trend director indicators)
- Determining when to take a position (The trade activator indicators).
Longer ATR stop line = red line;
Shorter ATR stop line = yellow line.
Up trend:
- ATR stops must be below the charts, (the shorter and the longer atr stop indicators) its easy to spot a reversal of the atr stop, if the close of the bar is below or above the atr stop line, it means a reversal, it’s the close and not the high or low of the bar that determines that;
- The dots in the chart must be blue;
- Histobands indicator must be in blue color or above zero;
- CCI_T3 indicator must be blue or above zero;
- Bar color indicator must be blue.

Down trend:
- ATR stops must be above the charts;
- The dots in the chart must be red;
- Histobands indicator must be in red color or below zero;
- CCI_T3 indicator must be red or below zero;
- Bar color indicator must be red.
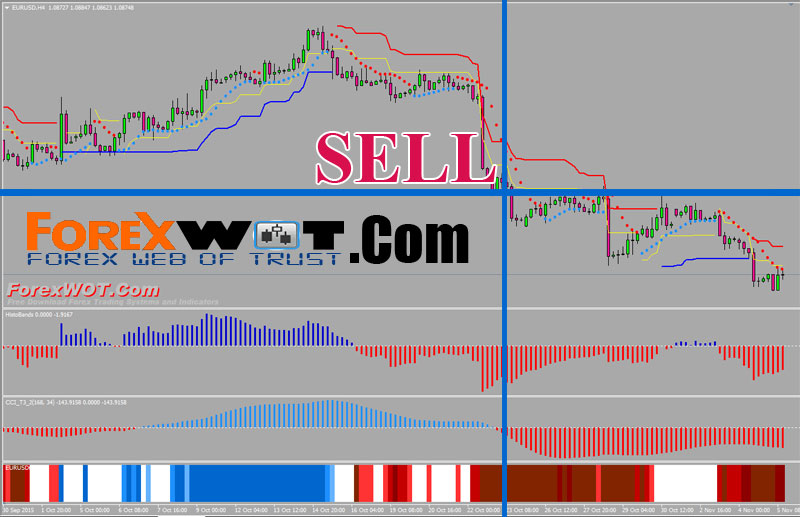
The rules I wrote above is just for determining the trend and not when to take aposition, to take a position you must be with right momentum, indicators will tell you that.
The main indicator for trade activator is the bar color, this indicator shows three are
- Blue = up trend;
- Red = down trend;
- White = neutral.
For taking buy position the blue color must appear after a white area, that’s perfect momentum to take a position, for this to happen all the others indicators must be too in uptrend situation like I said above, they determine the trend.
Now I said the bar color was the main indicator to determine when to take a position, but not the only, the unique indicator that does not serve for trade activation is the CCi_T3, this one is only for determining the trend! If you take a position when CCI_T3 changes trend direction you are not in a good momentum.
If the bar color triggers buy position and for example if the atr stops are not below the chart or the dots are not blue you wait for these indicators to turn direction, the same for the histobands, if the histobands is still red, wait for it to turn blue, if you don’t wait you may take a false signal and loose the trade, now for this to happen the CCI_T3 had to be already in blue color before the bar color indicator turning to blue; For taking sell position is the opposite.
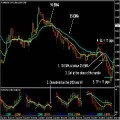
In this case was an example of a false sell signal because the bar chart was not below the shorter atr line yet. I call the bar color the main indicator for trade activation because it must be the first one to trigger a position, then you can wait for the others indicators to trigger too.
Now I will give you an example of when is a permanent false signal and there is no wait for the others indicators to trigger:
Has you see the indicator CCI_T3 that only serves for determining the trend and does not for trading activation is blue, so there is no wait for it to turn red, it is a permanent false sell signal.
Exits
Has you know this is a trend following system, so you want to ride the trend.
The shorter atr line is for taking profits, the longer atr line is for stop loss, the stop loss and take profit are dynamic, they changes throw the development of the trend.
The take profit atr line(yellow line), is only for when you are in profit, if this line is in the area where you loose the trade you won’t want to stop the trade there, you want to loose the trade only in the longer atr stop line, the
shorter line is only for take profits! Stop losses should be 5 pips above or below the red line.
When you move for the 2? stop loss, the 1? stop loss will nullify off course, the same for take profit line.



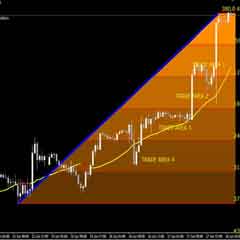
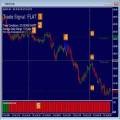

Looks to be a robust trading system for those who don’t have time to watch every tick during the day. In other words, just what I was looking for!
Thank You!