FREE DOWNLOAD High Probability Trend-Reversal 5 EMA High/Low Trading System and Strategy – This is the most simple strategy based on momentum and candlestick analysis, which was called Trend Reversal.

The strategy most often used for intraday trading for the purpose of profit making during the trading session, but the most profitable time frame is D1 (Daily chart).
If you are currently experiencing any of the following trading problems you will benefit significantly from making the daily chart your primary trading time frame:
Trading Inconsistently with Daily Chart
If you are confusing yourself by focusing on many different time frames and not focusing on the daily charts as your main time frame, you are very likely getting inconsistent trading results, at best.
Traders who jump around from the 5 minute chart to the 30 minute chart and back again, are naturally less likely to have a consistent and smooth long-term equity curve than those traders who put their focus mainly on the daily charts.
This is because traders using lower time frames are naturally going to be taking much more low-probability trade setups than traders focusing on the daily charts, and low time-frame traders are also more likely to over-trade, this means significantly less consistent trading results over the long-term.
But of course, it doesn’t matter whether you trade Hourly or Daily time frame, it depends on your daily lifestyle and your mentality to find a time frame and a trading horizon that works best for you.
Knowing how to follow the trend in Forex is often not enough.
Even the strongest trending markets sometimes become reversed out of the blue.
Therefore, knowing how to identify TREND REVERSALS and CORRECTIONS increases your chances of success and allows to benefit from the market more.

There is no method that can show you how to identify trend reversal with 100% accuracy. Instead, what you can do is to read the price action and identify the possible area where the market could reverse.
Instead, what you can do is to read the price action and identify the possible area where the market could reverse.
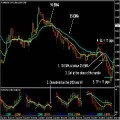
These are some simple rules to trade the market using 5 EMA (HIGH-LOW).
When the price upward above 5 EMA (High) – trend is expected to be up with support at 5 EMA (High) and next level of support comes near 5 EMA (Low). Vice versa, when the price below 5 EMA (Low) then the price is expected to be trend lower with resistance at 5 EMA low and next level of Resistance comes near 5 EMA (High).

If the price is in between 5 EMA (Low) and 5 EMA (High) trend is expected to be rangebound between 5 EMA (High) and 5 EMA (Low) with resistance at 5EMA (High) and support at 5 EMA (Low).
This “High Probability Trend-Reversal 5 EMA High/Low Trading Strategy” is based on the fact that any movement is never infinite. If the price for a few days is moving one direction, someday it will go the other.
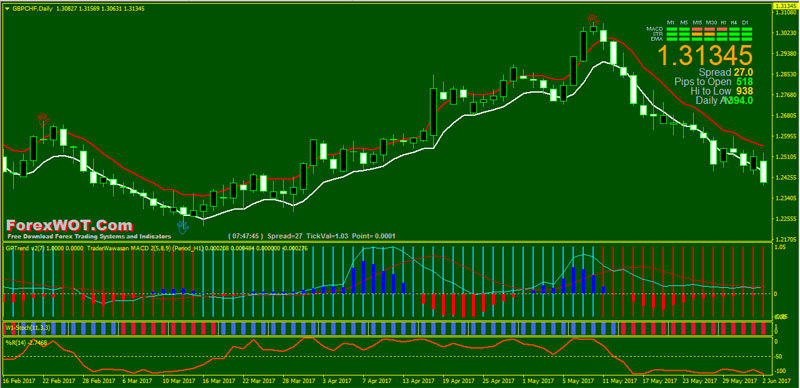
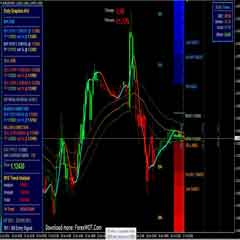
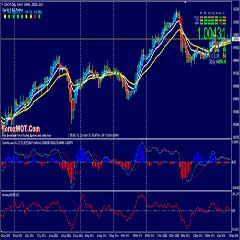
This is a trend-reversal system based on GP Reverse indicators, 5 EMA High/Low, MACD, and Stochastic.
You can use this system also in Multi time frame set the indicators of the next time frame. Example ( 30 tf setting indicators (GP MACA and GP Trend 60 tf.)
- Best Time Frames: H1,H4, and Daily
- Recommended Currency Pairs: Major Pairs
- GP Reverse
- GP Trend
- GP MACD
- Signal Trend
- Exponential Moving Average
- Stoch Tape
- Williams’ Percent Range
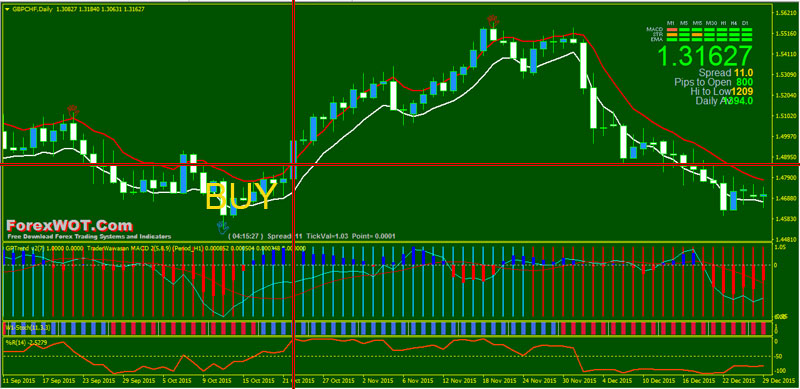
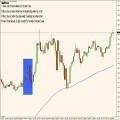
- GB Reverse signal below the previous swing low
- Price upward above 5 EMA (High)
- GP MACD Blue color
- Blue color GP Trend line upward and above Red color GP Trend line
- Stoch Tape Blue color
- WPR lineupward and above -50 level
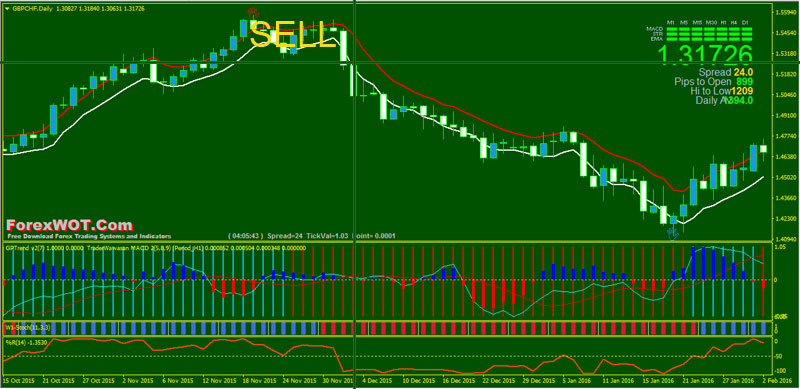
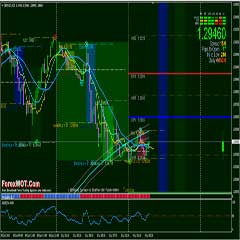
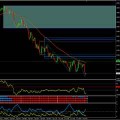
- GB Reverse signal above the previous swing high
- Price downward below 5 EMA (Low)
- GP MACD Red color
- Red color GP Trend downward and below Red color GP Trend line
- Stoch Tape Red color
- WPR line downward and below -50 level
There is no golden stop method. Your power on your MONEY MANAGEMENT.
It is crucial to avoid larger losses than necessary.
Losing 20% or more in one trade is unacceptable and is considered poor trading – it’s called Siegel’s Paradox. Large, even infrequent, losses are difficult to overcome.
How much are we risking relative to our account size?
Many traders use the 2% level.
For example, if we have $100,000 in our account, a maximum risk amount of $2,000 could be used for the trade.
If we’re risking more than 5% of our account, there is a high probability that our account will go bust as it is difficult to survive during extended and inevitable drawdowns.
 Foreign Exchange Currency Trading & Investment Strategy – Forex Z 20 System for Successful and Highly Profitable Forex Trader
 Simple Powerful and Effective Forex Price Action Trading Strategy Using Moving Average
 Best Forex & Stocks Trading Strategy with Dolly-Graphics System
 Foreign Exchange Trading : Online Forex Master Level Trading System and Strategy
 Sure Forex Breakout System Absolutely Amazing and Easy Forex Strategy
 200 EMA Robust IntraDay Trading and Stop Loss Strategy
 Forex EMA Trend Trading System Strategy with MACD and Range Factor (MACD)
 Forex Short Term Trend Trading : Advanced Exponential Moving Average (EMA) CrossOver Forex Trading System and Strategy
 Forex Breakout Trading Strategy with CCI and ADX
 RSI Momentum Secret Method Forex Trading System – Step by Step Tutorial

Can you please let me know how I can download the indicators for this specific strategy? I tried clicking through on the download button but it took me to the top 10 strategies. I couldnt find these indicators anywhere? Any help would be greatly appreciated 🙂