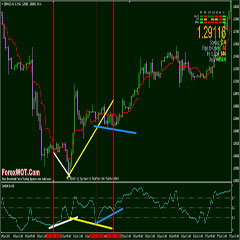
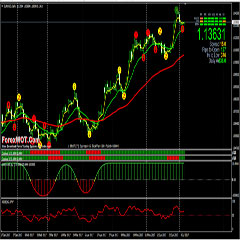
Trend Momentum Forex Binary Options Trading System – This is a High Accuracy Forex Binary Options Bull Bear Power with Open Close 20 EMA Trading System and Strategy. Use the 20 EMA open and close to determining medium trend direction and trade in that direction.

The Bull Power Indicator and Bear Power Indicator is a versatile indicator used to measure the strength of the bulls and bears in the market. The stronger one is over the other, the more quantified prices are. For example,
- In strong trending markets, bull powers are normally positive and bear powers are negative.
- But when there is a switch, meaning that bull powers turning negative and the bear powers turning positive, it indicates a strong move to the downside in the markets.
Besides the switch, the Bulls and Bears power indicator can also show extremes. In such instances for example, when the Bears power turns strongly negative, it also indicates a decline in prices while at the same time Bulls power indicator can remain in positive territory.
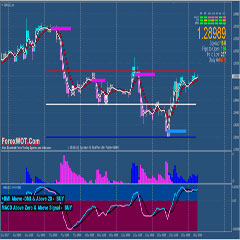
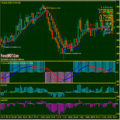
The Bulls Bears power indicator can be used as an oscillator where buy/sell signals are triggered when the indicator crosses above and below the 0-line. The following chart “Bull-Bear Power with Open-Close 20 EMA Trading System” illustrates the buy/sell signal generated by the Bulls Bears power moving above and below the 0-line.
Forex Binary Options Bull Bear Power with Open Close 20 EMA Trading System and Strategy (Bull-Bear Power with Open-Close 20 EMA Trading System) is a slow trend-momentum Trading System.
This system works best on 15M – 30M – 1H – 4H and Daily timeframes and any currency pairs.
The rules are very easy and straight forward.
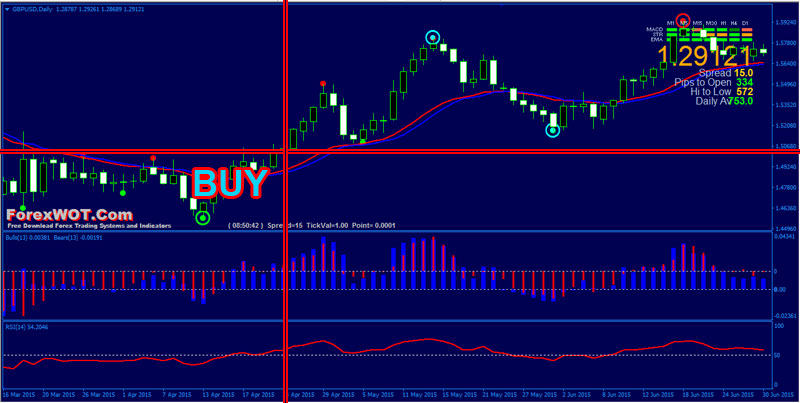
- Red bars Bear Power upward above 0 level
- Blue bars Bull Power upward above 0 level
- RSI line upward above 50 level
- Red color line 20 EMA Close upward above Blue color 20 EMA line
- Signal Trend green color
- Lime color dot-circle X 3 Semafor indicator below the previous swing low
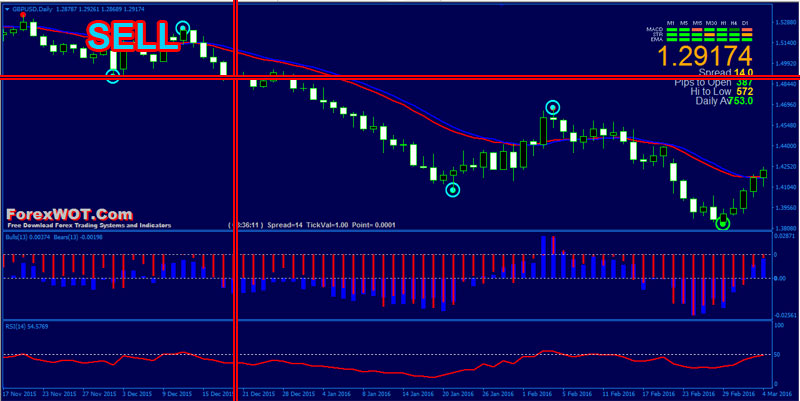
- Red bars Bear Power downward below 0 level
- Blue bars Bull Power downward above 0 level
- RSI line downward below 50 level
- Red color line 20 EMA Close downward below Blue color 20 EMA line
- Signal Trend red color
- Lime color dot-circle X 3 Semafor indicator above the previous swing high
The Triple Screen method for this indicator suggests identifying the price trend on a higher chart interval (like Daily charts) and applying the Bulls power technical indicator on a lower chart interval (like Hourly charts).
Signals are traded according to the indicator but only in the direction of the Forex price trend in the higher chart time-frame. This is an EXTREMELY ACCURATE Trading System.
[sociallocker]
[/sociallocker]


