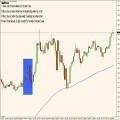
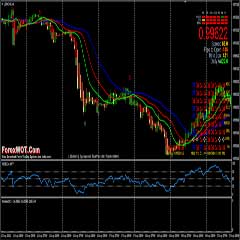
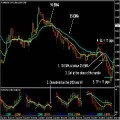
Powerful Forex Trading System – Yes…, This Camarilla Pivot Point Support Resistance a is powerful trading system and easy to use.
I think this (Camarilla SR) is one of the most powerful indicators. But you should use it in 2 timeframes. D1 and H4.
Professional traders always are in search of key levels that either repel price or, after trading through it, accelerate price action in a predictable direction.
The Camarilla pivot point and support resistance trading strategy is a technique that has an astounding accuracy in both regards, with a particularly reliable performance for day-trading equities.
Camarilla pivot points were discovered in 1989 by Nick Scott, a successful bond trader.
The basic thesis of this strategy is a common one: That price, as most time series, has a tendency to revert to its mean, right up until the point it doesn’t.
With Camarilla Pivots, short-term traders will commonly look at the daily variety.
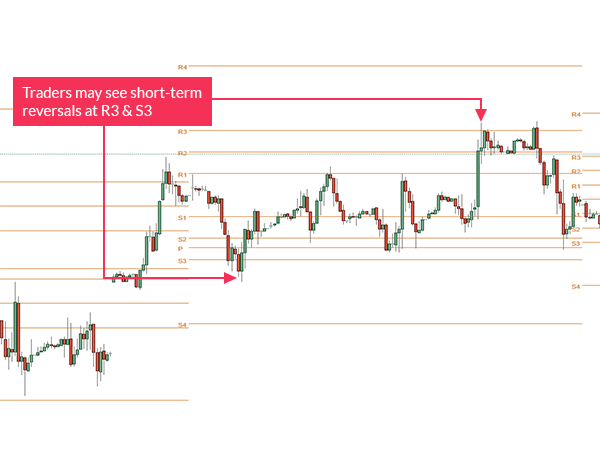
When price approaches the 3rd level of support or resistance, many traders feel the chance of a reversal may be imminent.
As such, those traders will often look to take profits at these levels if met while in a winning position.
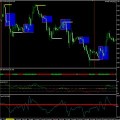
The picture below will show 2 reversals taking place on the same day on AUDUSD.
Alternatively, many traders also feel that if the 4th level of support or resistance is hit the potential for a breakout may be increased.
And if this is the case, those traders would want to contain the damage of incorrect trades if these levels get hit on losing positions, looking to place stops just outside of these prices.
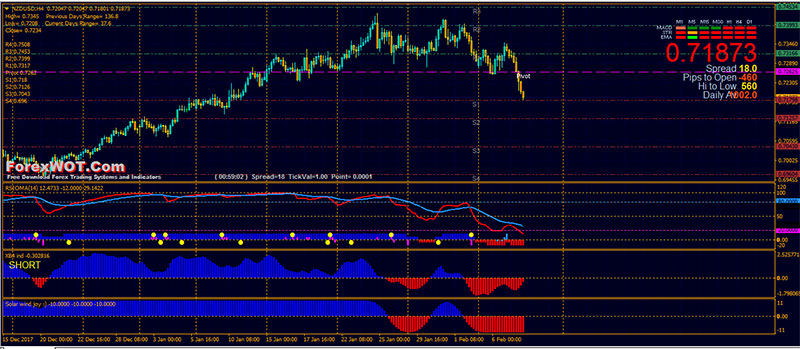
The use of support and resistance lines, such as camarilla pivots, can also be used in conjuncture with oscillators like RSIOMA.
- Best Time Frames: H4
- Most Recommended Currency Pairs: GBPUSD, EURUSD, USDJPY, and AUDUSD
- Camarilla SR
- RSIOMA
- Signal Trend
- XB4D Histo
- Solar Winds Joy Histogram
The benefit of this is that camarilla pivots outline an area for traders to plan for a market reversal.
Intraday resistance is typically found at the R3 resistance, while support for the day’s range is found at the S3 point.
Take a look at the image below.
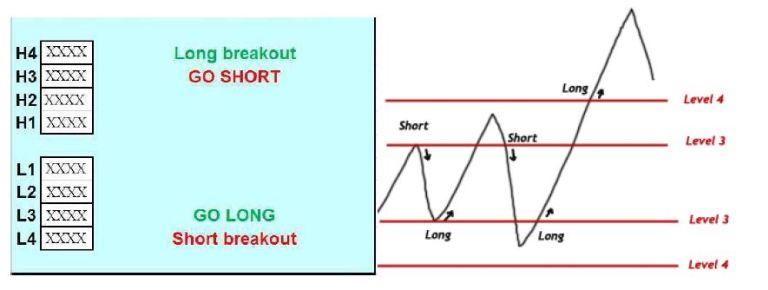
Open price is between R3 and S3.
You should use it in 2 timeframes. D1 and H4.
- For Long (BUY)
Wait for the price to go below S3 and then when it moves back above S3, buy. Stoploss will be when price moves below S4. Target1 – R1, Target2 – R2, Target3 – R3
- For Short (SELL)
Wait for the price to go above R3 and then when the price moves back below R3, sell. Stoploss will be when price moves above R4. Target1 – S1, Target2 – S2, Target3- S3
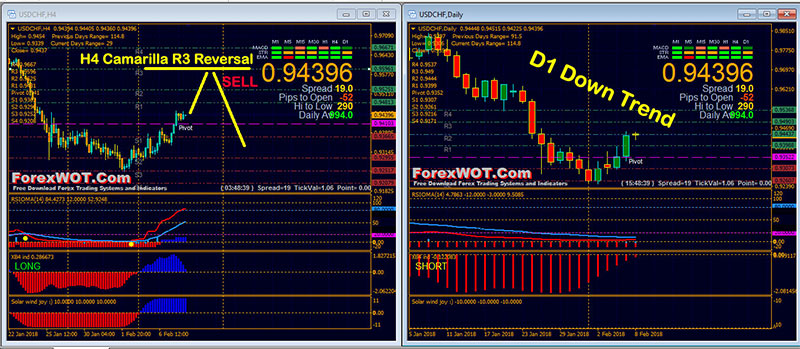
Try this yourself on different currency pairs and you will be astonished by the accuracy of this system.
Let us know if there is any question in the comments section.


