Forex Easy Advanced Mass Pips Makers Strategy. In this short course, you are about to find a few systems that only take you minutes to identify good trades. You’ll also get an indicator that will do all the works for you.
We are here to help your trading. So please be patient going through the materials and you can feel safe and relax to trade with our systems. So now let dive in!
This is the first system in our course. It uses 4 main indicators as follows:
- Heiken Ashi Candles : which is used to provide interpretation of market trends in a neat and descriptive way.
- Accelerator Oscillator : which is used to measure acceleration and deceleration of the current driving force.
- Awesome Indicator which is used to determines market momentum.
- Mega-Trend indicator ( Hull moving average ) : a fast moving average and gives quick signals for trend changes, excellent to use with a long term trend indicator!
Now, the first step you need to do is to install the chart template so that you can have 4 main components (Accelerator, Awesome Oscillator, Mega-Trend and Heiken Ashi Candles) appear on the chart for you automatically.
You don’t need to know how these indicators work. All you need to do is to follow this system step-by-step.
After installing Indicators an Template, you will find a readymade template named as masspip in your MetaTrader.
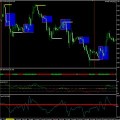
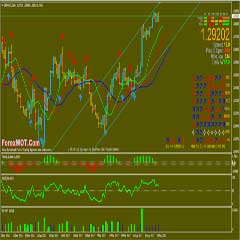
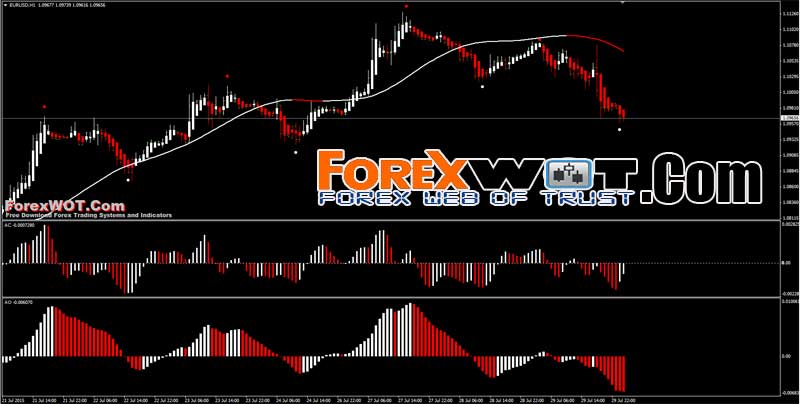
What you need to do is to Right click on chart >> click on “templates” >> choose masspip After that your chart will look like this:

This system can be used with any currency pair and any time frame. Best results with 15M, 30M and 1H time frames.
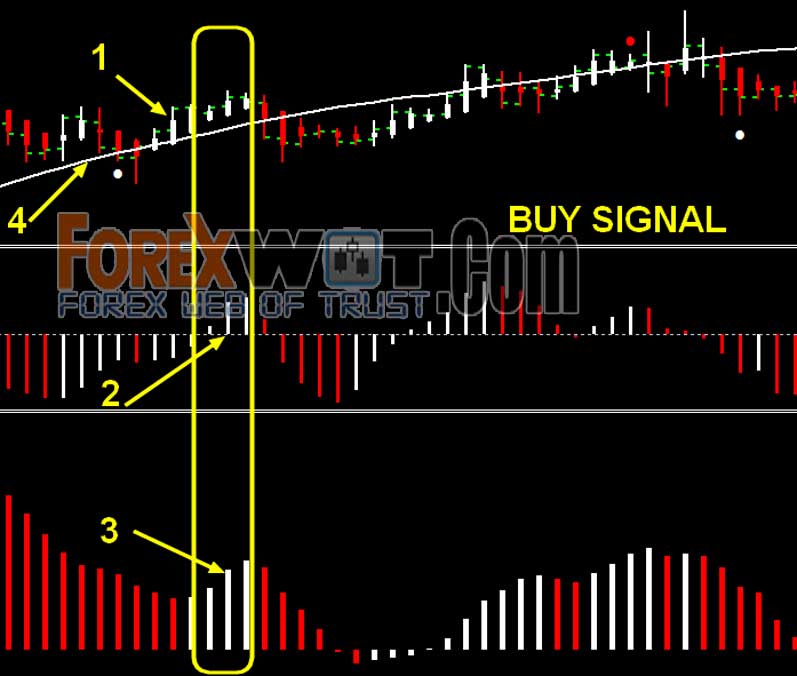
Enter a long trade when:
- White Candle ( Heiken Ashi indicator )
- White AC Bar ( Accelerator Oscillator indicator ) , best if it’s above 0.0 level
- White AO Bar ( Awesome Indicator ) , best if it’s above 0.0 level
- White Trend Line ( Megatrend indicator )
Enter a short trade when:
- Red Candle
- Red AC Bar ( best if it’s below 0.0 level )
- Red AO Bar ( best if it’s below 0.0 level )
- Red Trend Line

Setting target profit and stop loss is important in trading. It requires a bit experience. So if you are new to trading, you can use the following simple rules:
- Place target profit to 30 pips. And set stop loss to be the same.
You can use fixed numbers (as above), or support and resistance levels. But here is a great and easy way to set your targets and stop loss…
- TARGET: Close trade when you get an opposite signal
- STOP LOSS: White/Red Dots ( Shi Signal Indicator ).
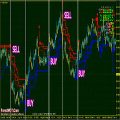
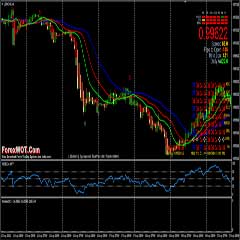
Shi Signal is an indicator that shows a possible reversal point to a trend. In the example below, you can see that we are about to enter a short trade, and use the previous Red Dot as the stop loss point.
You can apply the same way for long signal (use White Dot).

Close trade when you get opposite signal ..
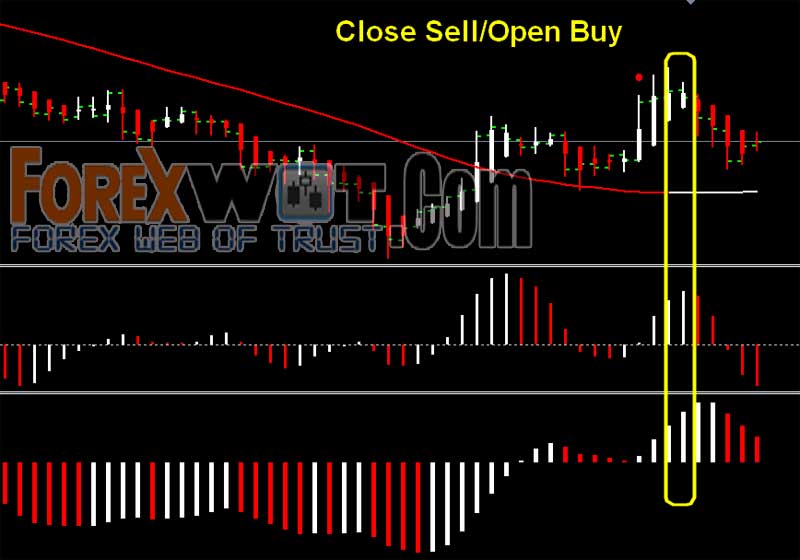
After you close a trade, if you see the reverse signal, you can immediately open a new trade.
Note: don’t use the dots (Shi Signal) indicator as entry/exit signal because it repaints. That means, it could change its current position if price changed.Use it only as stop loss point.
This technique is only for advanced traders. Please skip it if you are fairly new to trading. Divergence means that price and indicator are going in opposite ways. In this case, the indicator we are talking about is the AO indicator.
Example…
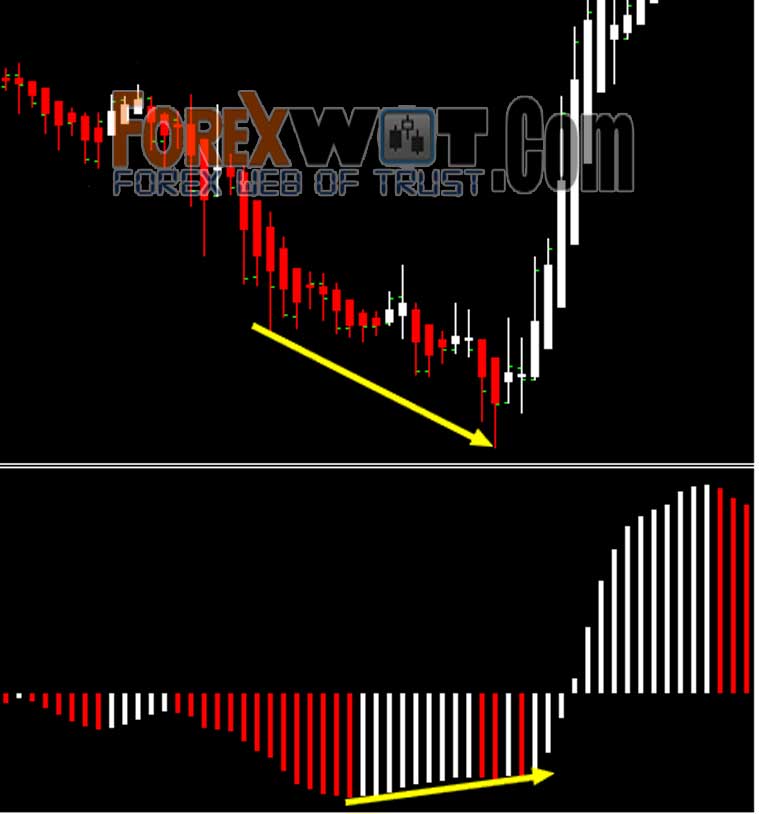
Use divergence as a confirmation signal.

Please note that this technique is optional, you can trade this system using the basic rules with great success.
Thank you for your attention. Please go ahead with the next system in our course after you master this trading system.
Pretty much any online forex broker you choose will have a trading platform that automatically calculates your profits and losses for you. But I think it’s important to understand the basic math behind it. It’s a good wayto make sure your broker is honest, plus it’s just good to know.
Besides, calculating profit and loss is really simple. There’s only two simple formulas to remember.
- When USD is the quote currency (the second currency in a pair), the formula is:
Profit = Price Change in Pips X Units Traded - When USD is the base currency (the first currency in a pair), the formula is:
Profit = Price Change in Pips X Units Traded / Exit Price
Let’s look at some real-life examples to help you understand.
First we’ll look at an example when USD is the quote currency.
To keep things simple we’ll assume the broker requires 1% margin, which means you can trade $100,000 in currency for only $1,000.
So let’s say you are looking at EUR/USD which is currently trading at 1.2518/9. You predict the euro will rise in value against the euro so you execute a trade to buy euros, which means you also simultaneously sell USD.
You buy $100,000 units at 1.2519. Remember since you are buying you have to take the ask price, which is the second number in the quote.
Your calculations are correct and the price rises to 1.2532/3. You initiate a trade to sell EUR and buy USD. This time you use the bid price, which is 1.2532.
Since you bought at 1.2519 and sold at 1.2532 your profit was 17 pips, or 0.0017. Now we need to convert that into real money.
So take your formula above:
Profit = Price Change in Pips X Units Traded
Or,
Profit = 0.0017 X 100,000 = $170.00
An easy rule to remember is that when trading a standard sized lot (100,000) of a currency pair in which USD is the quote currency, a pip is always equal to $10. 17 pips equals $170.
Now, let’s look at an example where USD is the base currency.
We’ll execute a buy of 100,000 units of USD/JPY at 117.22.
The price rises and we sell at 117.35. We just made 13 pips.
To calculate our profit we use the second formula:
Profit = Price Change in Pips X Units Traded / Exit Price
Or,
Profit = .13 X 100,000 / 117.35 = $110.78.


