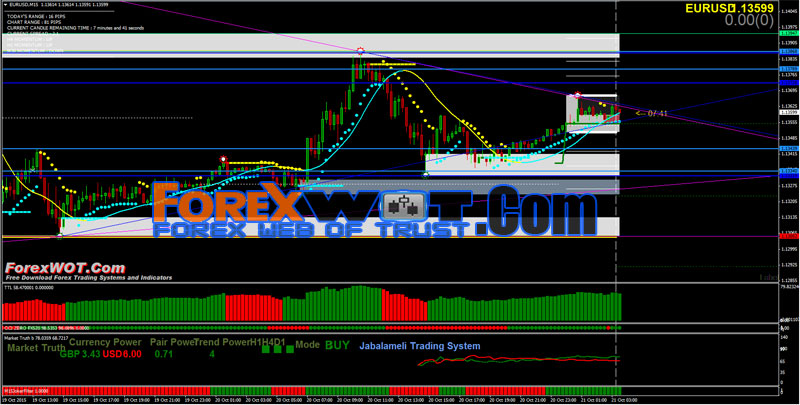
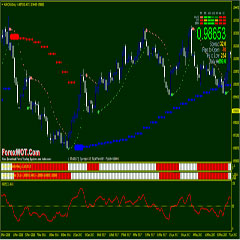
CCI Porabolic SAR Trading System is an intraday system trend following with price action analysis. The main rules of CCIPorabolic SAR System is trade only in the direction of the trend with the indicator of price action and trend in the same direction, but the first indicator that must agree l’order is Market Truth.
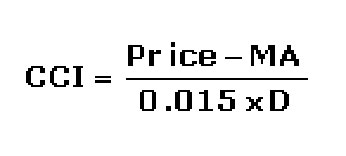
An oscillator used in technical analysis to help determine when an investment vehicle has been overbought and oversold. The Commodity Channel Index, first developed by Donald Lambert, quantifies the relationship between the asset’s price, a moving average (MA) of the asset’s price, and normal deviations (D) from that average. It is computed with the following formula:
The CCI has seen substantial growth in popularity amongst technical investors; today’s traders often use the indicator to determine cyclical trends in not only commodities, but also equities and currencies.
The CCI, when used in conjunction with other oscillators, can be a valuable tool to identify potential peaks and valleys in the asset’s price, and thus provide investors with reasonable evidence to estimate changes in the direction of price movement of the asset.
- Time Frame : 30 min- 60min.
- Financial Markets : Majors (EUR/USD, GBP/USD,AUD/USD, NZD/USD, AUD/JPY, USD/CHF, USD/JPY, USD/CAD, and Index (S&P 500, Dow Jones, DAX, FTSE).
- KPY
- Joker Filter
- Candle Down,
- Slope (60 period);
- Support and resistanste;
- 3Z Semaphor;
- Trend indicator;
- Market Truth;
- ATR projection
- Super Dem
- Pivot points,
Trade only in the direction of the trend with the indicator of price action and trend in the same direction, but the first indicator that must agree l’order is Market Truth.
- Joker Filter green Color
- Price action trend buy with trend line in up trend and super Dem in up trend.
- Market Truth: Buy, square green H1 and h4,
- Slope aqua color,
- CCI Zero green dot
- Trend indicator green bar.

- Joker Filter red color
- Price action trend sell with trend line in down trend and super Dem in down trend.
- Market Truth: Sell, square green H1 and h4,
- Slope yellow color,
- CCI Zero red dot
- Trend indicator red bar.
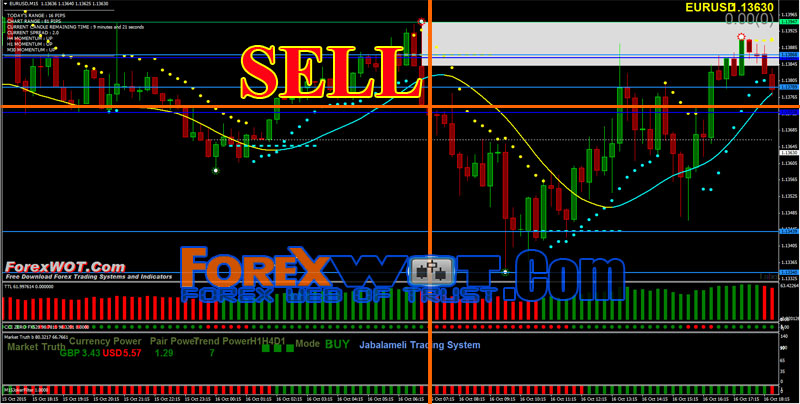
Exit position at the leve support and resistance pivot points ) or predetermined profit target. Initial stop loss on the previous swing high/low.
[sociallocker]
[/sociallocker]








Please can you kindly post the link to download this system??
I love this system. Hi Yinka, click FB like button to get the download link…