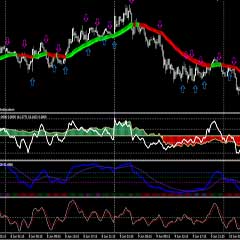
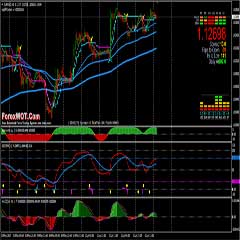
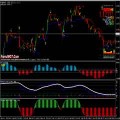
High accuracy “Forex RSIOMA Gold System” – RSIOMA MetaTrader indicator this indicator takes two moving averages, calculates their RSI (Relative Strength Index) and then also adds a moving average of the calculated RSI. These two lines now can accurately signal the trend changes. They are shown in the separate window where they change from 0 to 100. Additional histogram indicator is shown for quick reference below the lines.
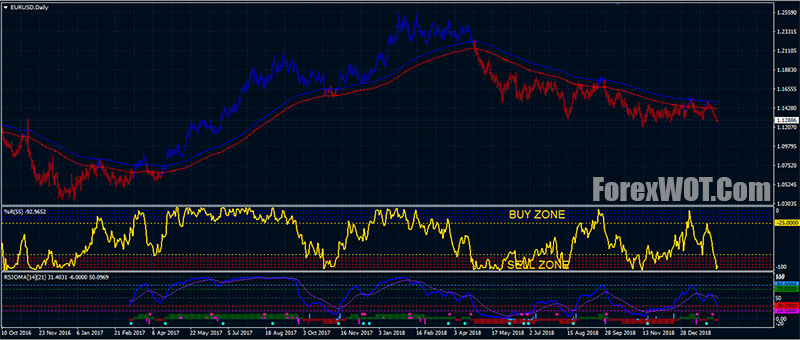
RSI above MA and RSI above level 50 is a signal of a bullish trend. RSI below MA and RSI below level 50 is a signal of a bearish trend.
- Time Frame: M30 higher
- Currency Pairs: Any
MetaTrader Trading Indicators
- RSIOMA
- Williams’ Percent Range
- RSI Chart Bars
- BUY Zone Fibs
- SELL Zone Fibs
BUY Rules
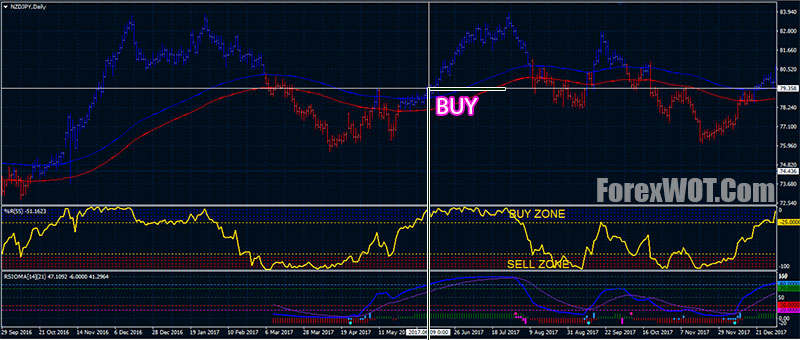
- RSIOMA: RSI below MA and RSI above level 50
- Williams’ Percent Range: At BUY ZONE
- RSI Chart Bars: Blue color
SELL Rules
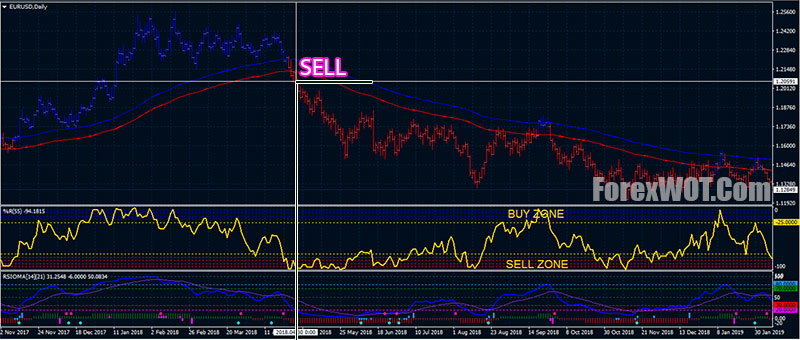
- RSIOMA: RSI below MA and RSI below level 50
- Williams’ Percent Range: At SELL ZONE
- RSI Chart Bars: Red color


