Best Forex Trend Indicators and Trading System -Forex Solar Winds Joy RSIOMA Trading Best forex trend indicator and trading system free download. This is the EAY ways to identify the direction of the trend.
Before we start going over how to identify and trade the trend, we should be first clear what we are looking for.
Markets can do one of three things: go up, go down, or move sideways.
But knowing what has happened after the fact is always the easy part.
The hard part is finding out what is currently happening when markets are moving in real time and the space on the right is empty – that’s where this article comes in.
To be clear, the article is to show you how to identify trading entries and market trends in a more efficient way.
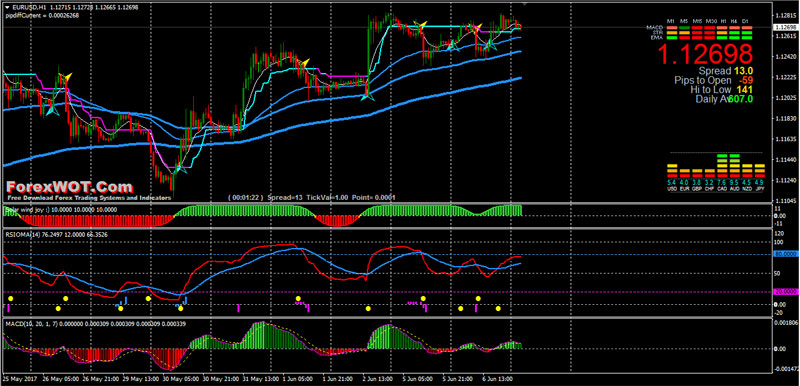
Forex Solar Winds Joy RSIOMA Trading System
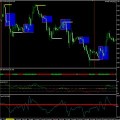
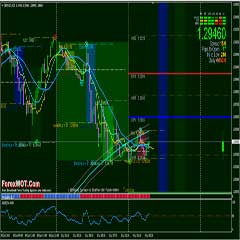
In this Forex Solar Winds Joy RSIOMA Trading System, the are indicators based on high accuracy trend indicator as:
- Solar Wind Joy indicator and XB4d indicator (repaint indicator),
- RSIOMA indicator based on the RSI
- MACD
- Trend Magic
- Exponential Moving Average
- Signal Trend
Best Time Frame: 30 min or higher
Recommended Currency Pairs: GBPUSD, EURUSD, USDJPY, …and all major pairs
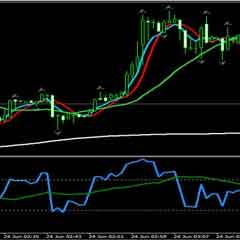
BUY Rules
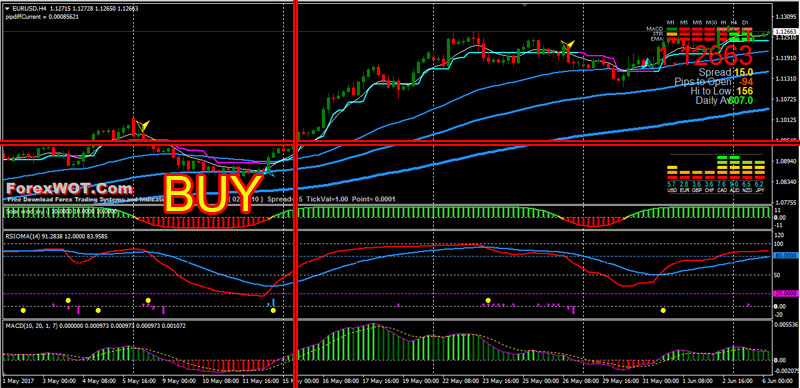
- Solar Wind Joy indicator green bars
- RSIOMA upward (Red line above blue line)
- MACD green histogram and above 0 level
- EMA 50 line above EMA 100 line
- EMA 100 line above EMA 200 line
- Price upward above EMA 8 line and AQUA color Trend Magic Indicator line
- Signal Trend green bars
SELL Rules
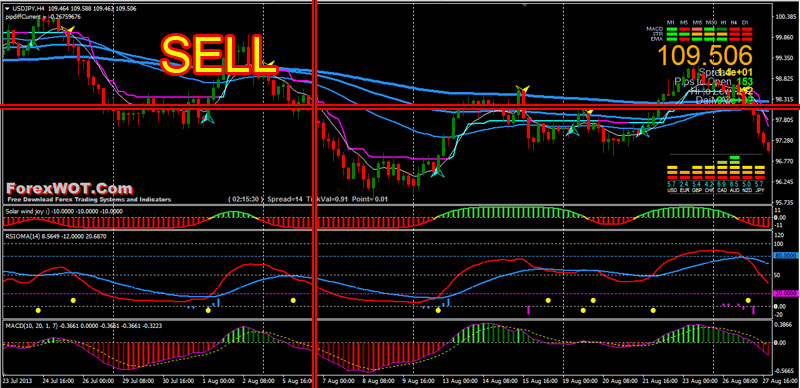
- Solar Wind Joy indicator red bars
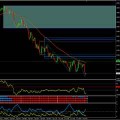
- RSIOMA downward (Red line blow blue line)
- MACD red histogram and below 0 level
- EMA 50 line below EMA 100 line
- EMA 100 line below EMA 200 line
- Price downward below EMA 8 line and AQUA color Trend Magic Indicator line
- Signal Trend red bars
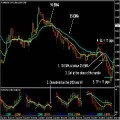
In this Forex Solar Wind Joy RSIOMA Trading System we used the 50 EMA which is a mid-term moving average.
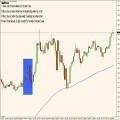
You can see that during an uptrend, price always stayed well above the moving average and during a downtrend, price always stayed well below the Moving Average.
If you want to use moving averages as a filter, you can apply the 50 EMA to the daily timeframe and then only look for trades in the direction of the daily EMA on the lower timeframes.


