The Most Powerful Moving Average Trading Strategy Every Trader Should Know. By mastering this strategy, even novice traders can triple their trading accuracy.

To use this strategy, traders usually look for two moving averages with different lengths. As mentioned earlier, in this strategy, the best combination is the 34-period Linear Weighted Moving Average and the 10-period Linear Weighted Moving Average.
In this basic strategy, you can easily find high-accuracy trading signals. This strategy is well-suited for scalping because almost all of its trading signals are accurate, although sometimes they provide small profits and sometimes large profits.
These are the details of the strategy.
- Download “ForexWOT-LWMASystem” (Zip/RAR File).
- Copy mq4 and ex4 files to your Metatrader Directory …/experts/indicators/
- Copy the “ForexWOT-LWMASystem.tpl” file (template) to your Metatrader Directory …/templates /
- Start or restart your Metatrader Client.
- Select Chart and Timeframe where you want to test your forex system.
- Right-click on your trading chart and hover on “Template”.
- Move right to select “ForexWOT-LWMASystem” trading system and strategy.
- You will see the “ForexWOT-LWMASystem” is available on your Chart.
Here are the trading rules:
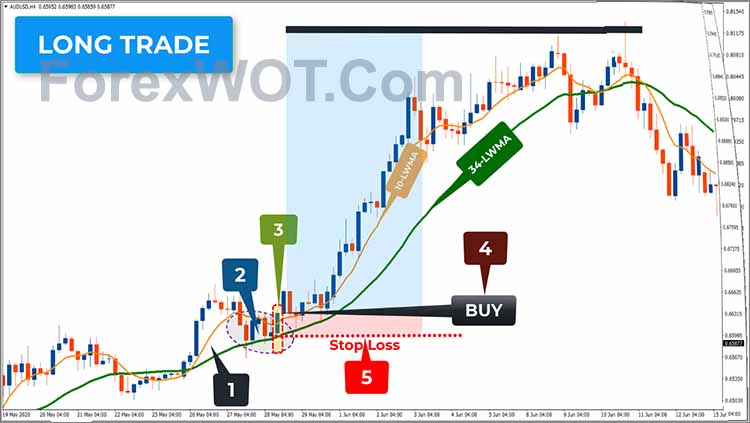
- The 10-period Linear Weighted Moving Average is above the 34-period Linear Weighted Moving Average, indicating a bullish market trend. A bullish trend is considered strong if the candle moves above the 10-period Linear Weighted Moving Average line. This is the bullish trend condition required in this strategy.
- Wait until the price falls between the 10-period Linear Weighted Moving Average and the 34-period Linear Weighted Moving Average. This means that the two Moving Average lines have not crossed, indicating that the bullish trend is still intact.
- Wait until a bullish candle forms with its closing price above the 10-period Linear Weighted Moving Average line.
- If this bullish candle forms, it signals that the bullish trend is about to resume, and the trader should immediately open a BUY position on the next candle.
- Don’t forget to place a stop loss below the 34-period Linear Weighted Moving Average line.
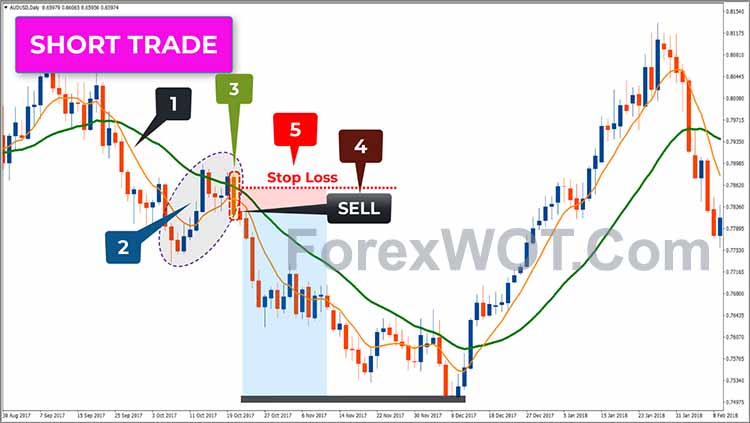
- The 10-period Linear Weighted Moving Average is below the 34-period Linear Weighted Moving Average, indicating a bearish market trend. A bearish trend is considered strong if the candle moves below the 10-period Linear Weighted Moving Average line. This fulfills the required condition for a bearish trend in this strategy.
- Wait until the price rises between the 10-period Linear Weighted Moving Average and the 34-period Linear Weighted Moving Average. As mentioned earlier, this means that the two Moving Average lines have not crossed, indicating that the bearish trend is still intact.
- Wait until a bearish candle forms with its closing price below the 10-period Linear Weighted Moving Average line.
- If this bearish candle forms, it signals that the bearish trend is about to resume, and the trader should immediately open a SELL position on the next candle.
- Don’t forget to place a stop loss above the 34-period Linear Weighted Moving Average line.
As we can see from this trading strategy example, it is exceptional because it often provides large profits compared to the risk we set through the stop loss. This means that if you are disciplined in applying this rule, you can become a successful trader.
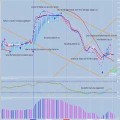
We’ll stick to the trading rules used in the first strategy but add a signal filter using the MACD indicator. Some traders might find this analysis technique more complex, but it’s actually not complicated if you follow my explanation carefully. So, let me explain directly through the trading rules.
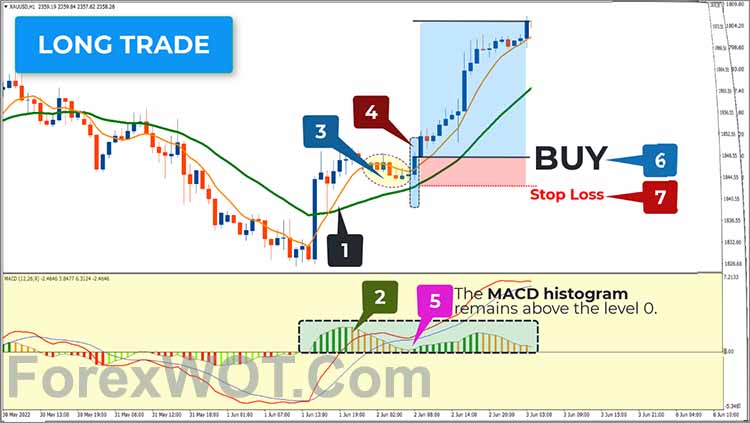
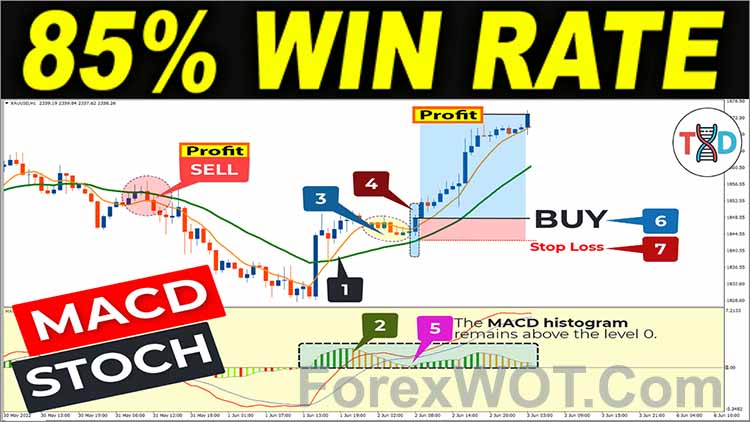
- The 10-period Linear Weighted Moving Average is above the 34-period Linear Weighted Moving Average, indicating a bullish market. A bullish trend is considered strong if the candle moves above the 10-period Linear Weighted Moving Average line. This fulfills the required condition for a bullish trend in this strategy.
- The MACD shows a bullish market, indicated by the Histogram being above the level 0.
- Wait until the price falls between the 10-period Linear Weighted Moving Average and the 34-period Linear Weighted Moving Average. This means that the two MA lines have not crossed, indicating that the bullish trend is still intact.
- Wait until a bullish candle forms with its closing price above the 0-period Linear Weighted Moving Average line.
- Ensure that during this correction phase, i.e., steps 3 and 4, the MACD histogram remains above the level 0. This is a strong indication that the market truly intends to continue its bullish trend. And this is a rare event in the market. So, if it happens, you should be able to make the most of it to reap maximum profits.
- If the bullish candle forms, it signals that the bullish trend is about to resume, and the trader should immediately open a BUY position on the next candle.
- Don’t forget to place a stop loss below the 34-period Linear Weighted Moving Average line.
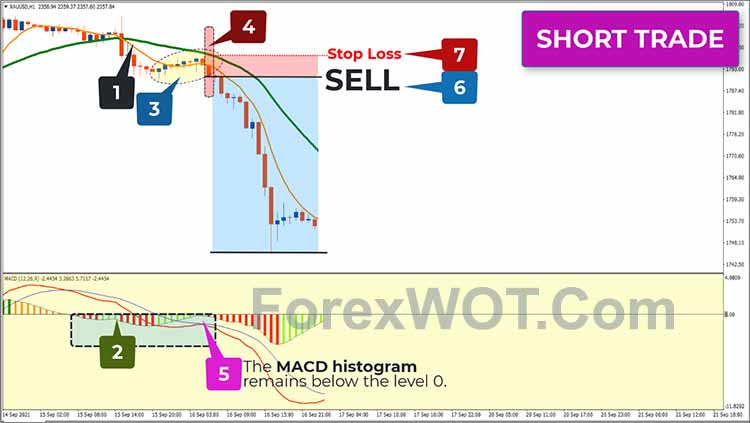
- The 10-period Linear Weighted Moving Average is below the 34-period Linear Weighted Moving Average, indicating a bearish market. A bearish trend is considered strong if the candle moves below the 10-period Linear Weighted Moving Average line. This meets the required condition for a bearish trend in this strategy.
- The MACD shows a BEARISH market, indicated by the Histogram being BELOW the level 0.
- Wait until the price falls between the 10-period Linear Weighted Moving Average and the 34-period Linear Weighted Moving Average. As I mentioned earlier, this means that the two Moving Average lines have not crossed, indicating that the bearish trend is still intact.
- Wait until a bearish candle forms with its closing price below the 10-period Linear Weighted Moving Average line.
- Ensure that during this correction phase, i.e., steps 3 and 4, the MACD histogram remains below the level 0. This is a strong indication that the market truly intends to continue its bearish trend. And once again, this is a rare event in the market. So, if it happens, you should be able to make the most of it to reap maximum profits.
- If this bearish candle forms, it signals that the bearish trend is about to resume, and the trader should immediately open a SELL position on the next candle.
- Don’t forget to place a stop loss above the 34-period Linear Weighted Moving Average line.
As I mentioned before, these special trading signals rarely occur. But when they do, it’s almost certain that the trading signals are correct. However, you still need to protect your money by placing stop losses as I showed in the previous examples. Because there is no strategy that is 100% successful.
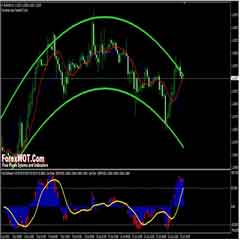
In our third strategy, we still follow the basic trading rules as applied in the first and second strategies. However, the key point to note is that we only enter positions when the price reaches saturation points, whether it’s overbought or oversold. The goal is to trade at price levels that offer maximum returns compared to the risk.
Let me explain this strategy through the trading rules to make it easier for you to understand.
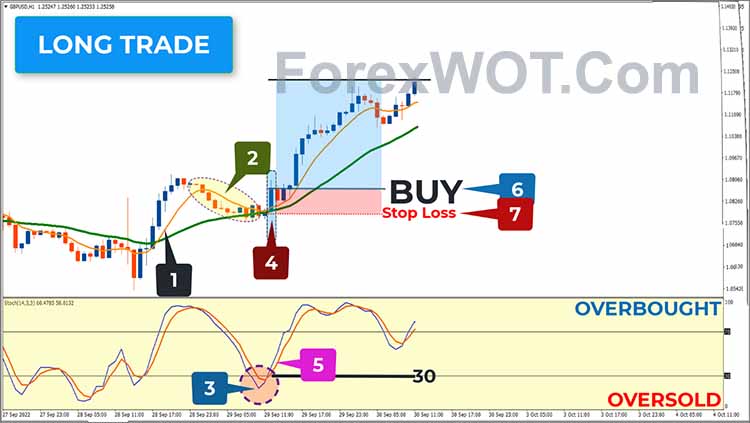
- The 10-period Linear Weighted Moving Average is above the 34-period Linear Weighted Moving Average, indicating a bullish market. A bullish trend is considered strong if the candle moves above the 10-period Linear Weighted Moving Average line. This fulfills the required condition for a bullish trend in this strategy.
- Wait until the price falls between the 10-period Linear Weighted Moving Average and the 34-period Linear Weighted Moving Average. This means that the two MA lines have not crossed, indicating that the bullish trend is still intact.
- The Stochastic Oscillator is in the oversold area, below the level 30.
- Wait until a bullish candle forms with its closing price above the 10-period Linear Weighted Moving Average line.
- Ensure that when the bullish candle forms, the Stochastic Oscillator also exits the oversold area or crosses above level 30 from below. This is a strong indication that the market truly intends to continue its bullish trend and will rise even further. Remember, this is a rare event in the market. So, if it happens, you should be able to make the most of it to reap maximum profits.
- If this bullish candle forms, it signals that the bullish trend is about to resume, and the trader should immediately open a BUY position on the next candle.
- Don’t forget to place a stop loss below the 34-period Linear Weighted Moving Average line.
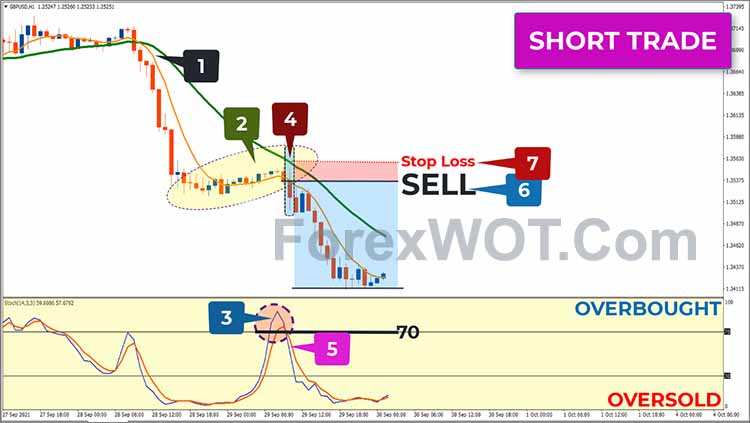
- The 10-period Linear Weighted Moving Average is below the 34-period Linear Weighted Moving Average, indicating a bearish market. A bearish trend is strong when the candle moves below the 10-period Linear Weighted Moving Average line, meeting the criteria for this strategy.
- Wait for the price to rise between the 10-period Linear Weighted Moving Average and the 34-period Linear Weighted Moving Average. As I mentioned earlier, this means the two MA lines haven’t crossed, indicating the bearish trend is still intact.
- The Stochastic Oscillator is in the overbought area, above level 70.
- Wait until a bearish candle forms with its closing price below the 10-period Linear Weighted Moving Average line.
- Make sure that when the bearish candle forms, the Stochastic Oscillator also exits the overbought area or crosses below level 70 from above. This strongly indicates the market intends to continue its bearish trend and will decline further. Again, you need to know, this is a rare event in the market. So, if it happens, you should be able to make the most of it to reap maximum profits.
- If this bearish candle forms, it signals the bearish trend is resuming, and the trader should immediately open a SELL position on the next candle.
- Don’t forget to place a stop loss above the 34-period Linear Weighted Moving Average line.
As I mentioned earlier, these special trading signals rarely occur. But when they do, it’s almost certain the trading signals are correct.
However, you still need to protect your money by placing stop losses as I showed in the previous examples. Because no strategy is 100% successful.
Now you’ve fully understood this highly reliable double moving average trading strategy.
From my experience, the first strategy I explained in this video should be thoroughly understood by traders who want success because it can serve as an important foundation if you want to develop your own trading strategy. While strategies 2 and 3 are one of the treasure map routes you should pay serious attention to in trading.
 2 MACD Effortless Forex & Stocks Swing Trading Strategy
 MA COBRA Forex & Stocks Trading Strategy (Extremely Low Risk High Reward Trading Strategy) (COBRA SYSTEM)
 FREE DOWNLOAD 20+ Best Forex MACD-Moving Average Trading System
 Foreign Exchange Trading : Online Forex Master Level Trading System and Strategy
 Stocks and Currency Trading With GUPPY Multiple Moving Averages Trading System
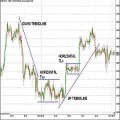 How to Do Accurate Forex Trend Line Analysis
 TOP10 BEST Full Time Forex Trader Trading System and Strategy
 Forex Trend Trading Tricks Of The Successful Forex Trader
 Forex Trading Short Course – How to Trade Forex with COG Trading Indicators and Strategy
 TOP 10 Best Bollinger Bands Forex Trading System and Strategy
