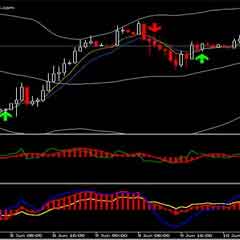
Easy Trade Forex with Moving Average and Bollinger Bands – Moving averages are simple to use and can be effective in recognizing trending, ranging, or corrective environments so that you can be better positioned for the next move. Often traders will use more than one moving average because two moving averages can be treated as a trend trigger.
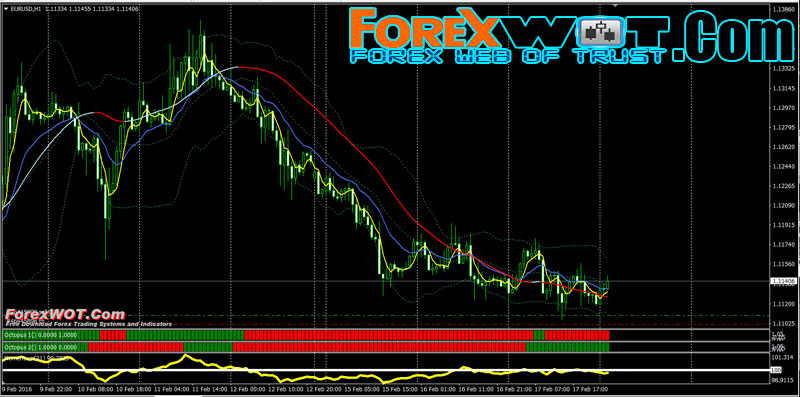
Moving Averages are often the first indicator that new traders are introduced to and for good reason. It helps you to define the trend and potential entries in the direction of the trend. However, moving averages are also utilized by fund managers & investment banks in their analysis to see if a market is nearing support or resistance or potentially reversing after a significant period.
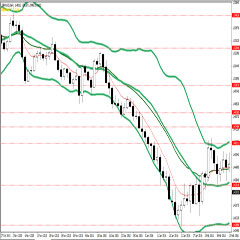
Bollinger Bands® is the second important indicator I use along with Moving Average. In fact, the combination of Moving Average and Bollinger Bands creates the strong trade setups I look for.
Bollinger Middle Band is nothing but a simple moving average. Bollinger Upper and Lower Bands measure deviations. I can bring their formula here, but it will not have any usage for your trading. The only thing we should know is that they are so strong in locating the trends and reversals. Combining the Moving Average with Bollinger Bands, creates a great trading system that shows the strongest continuation and reversal trade setups.
When looking to use moving averages, you’re ability to control downside risk will determine your success. It’s important to know that markets that were once trending, with very clean moving average signals, to a range with more noise than signals. If you can get comfortable with a specific set of moving averages, you can objectively analyze and trade the FX market week in and week out.
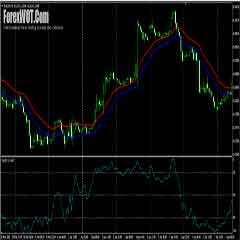
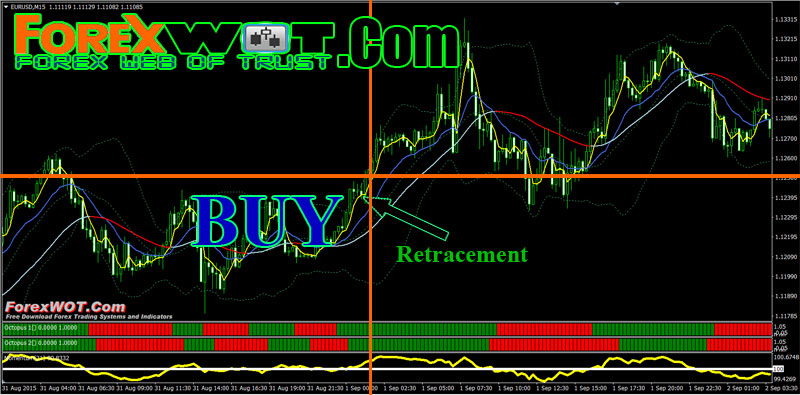
- Hull Moving Average (80) blue and upward
- Moving Average 13 above Hull MA 80
- Candle above upward Moveng Average 5 and above midle bollinger bands
- Moving Average 5 above Hull Moving Average 80 and Moving Average 13
- Momentum upward and above 100 line
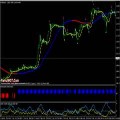
- Octopus 1 and Octopus 2 green
- Wait for retracement candle and than and than OP BUY after Retracement candle.
- Hull Moving Average (80) redand downward
- Moving Average 13 below Hull MA 80
- Candle below upward Moveng Average 5 and below midle bollinger bands
- Moving Average 5 below Hull Moving Average 80 and Moving Average 13
- Momentum down and below 100 line
- Octopus 1 and Octopus 2 red
- Wait for retracement candle and than OP SELL after Retracement candle.

Important News Releases NOTE :
Important economic news reports are usually released at the same well known time on the regular basis. All reputed brokers have the detailed economic calendar review at their sites. Please visit your broker web site, most likely you will find Forex Calendar or Economic Calendar there.
Big price moves that may take place during the news releases are not necessarily of long duration. This is the reason why we recommend closing the orders only before the economic news that may have an impact on the currency pairs you are trading with. And the decision about opening the orders again should be taken a bit later, when the market stabilizes.


