Williams Percent Range – The BEST “OSCILLATOR” for Scalping & Swing Trading – Today we will concentrate on one technical indicator known as the Williams Percent Range oscillator. Here you will learn what the Williams Percent Range Indicator is and how to use it to upgrade your trading game.
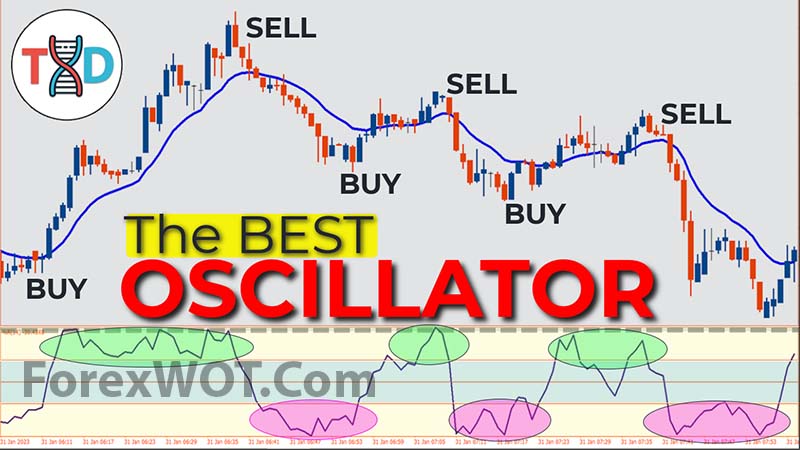
Williams Percent Range, is a momentum oscillator that measures that oscillates between the level 0 to -100 and is used to determine whether an asset has been overbought or oversold. The Williams Percent Range indicator borrows and works within the same lines as the Stockhastic Oscillator.
As a continuation strategy, we will focus on
- Williams R % -50 level
- Overbought and oversold zones
- Moving Averages Trend
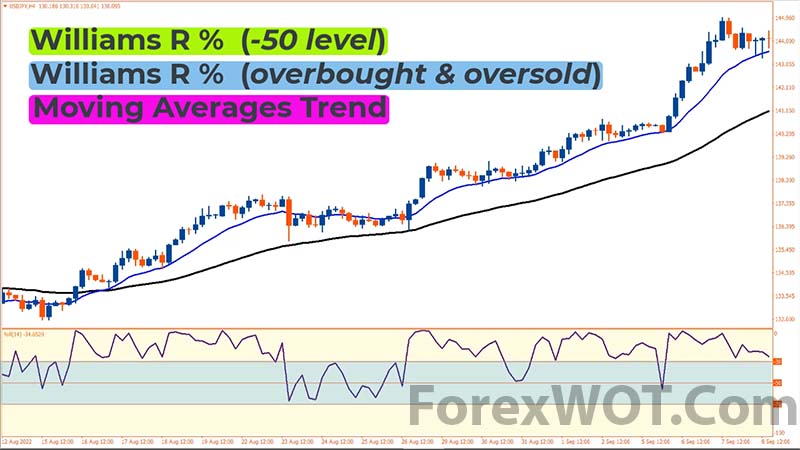
This is because it shows a clear difference between the real overbought and oversold readings on the % R indicator. As such, it implies a change in momentum of the price action of a specific security or financial instrument.
- Download “ForexWOT-SuperOscillatorSystem” (Zip/RAR File).
- Copy mq4 and ex4 files to your Metatrader Directory …/experts/indicators/
- Copy the “ForexWOT-SuperOscillatorSystem.tpl” file (template) to your Metatrader Directory …/templates /
- Start or restart your Metatrader Client.
- Select Chart and Timeframe where you want to test your forex system.
- Right-click on your trading chart and hover on “Template”.
- Move right to select “ForexWOT-SuperOscillatorSystem” trading system and strategy.
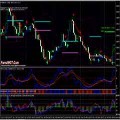
- You will see the “AW%R Super Oscillator System” is available on your Chart.
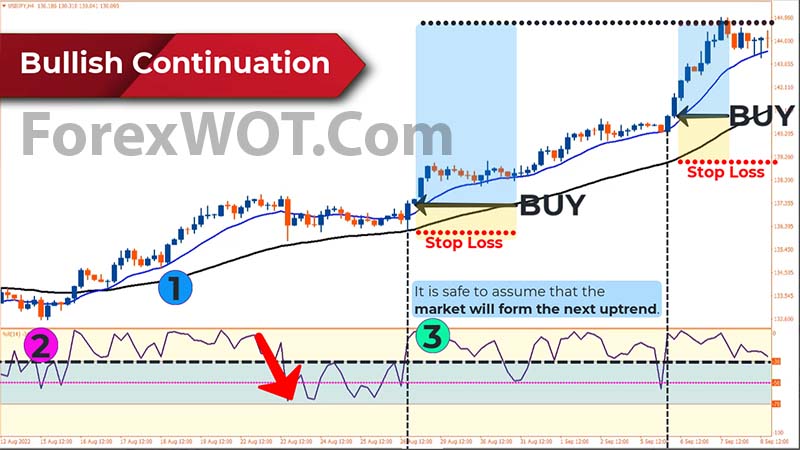
- 1st. Price above the moving Averages
- 2nd. The % R indicator above the -30, or overbought level
- 3rd. When the % R indicator goes upward past the -30 level again, after hitting the first “overbought level” and bounce downward below the “-50 level”, it is safe to assume that the market will form the next uptrend
- Open BUY will only be done if the % R indicator goes upward past the -30 level for the 2nd time and so on
- Place a stop loss below the lowest Moving Average.
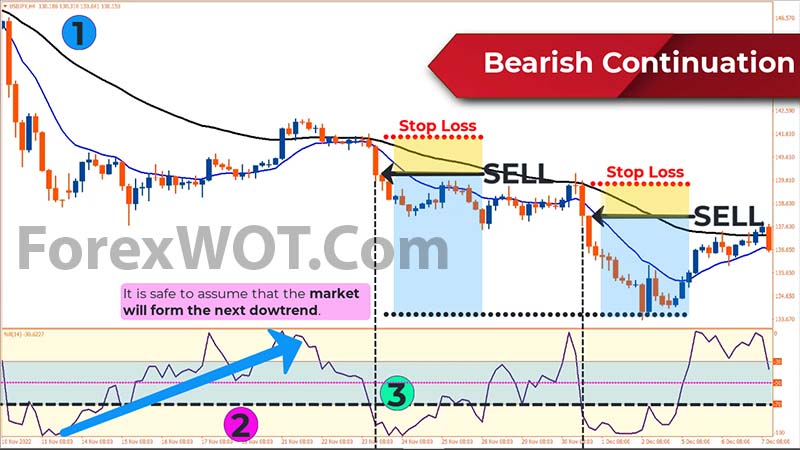
- 1st. Price below the moving Averages
- 2nd. The % R indicator below the -70, or oversold level
- 3rd. When the % R indicator goes downward past the -70 level again, after hitting the first “oversold level” and bounce upward above the “-50 level”, it is safe to assume that the market will form the next downtrend.
- Open SELL will only be done if the % R indicator goes downward past the -70 level for the 2nd time and so on.
- Place a stop loss above the highest Moving Average.
The Williams % R trading strategy can be considered profitable especially when used correctly. As it does not indicate the market direction, it provides better results when combine with another indicator such as the Moving Average, Heiken Ashee, kumo, and Trendlines.


