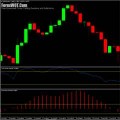
Improving Accuracy by 3x while Maximizing Profit Potential – You’re already familiar with the basic rules of Bulls Power and Bears Power Indicators developed by Dr. Alexander Elder, also known as the Elder-Ray trading strategy. And now, here’s a robust strategy capable of tripling the accuracy of the Elder-Ray trading strategy while maximizing its profit potential.

This strategy is known as The Avatar Trading Strategy as it involves four main elements of market technical conditions:
- Bullish Power
- Bearish Power
- Market Trend
- Market Saturation or Overbought and Oversold conditions
Since The Avatar trading strategy functions to pinpoint the most profitable market entry timings as determined by the Elder-Ray trading strategy, traders only need to add the Stochastic Oscillator to identify Elder-Ray signals in the Overbought and Oversold areas.
![]()
Thus, if market price movements are in the oversold area, traders simply await the BUY signal generated by The Elder-Ray strategy. Conversely, if market price movements are in the overbought area, traders only need to wait for the SELL signal generated by The Elder-Ray strategy.
What needs to be noted in The Avatar Strategy is that the Stochastic Oscillator setting is (13, 3, 3), following the periods specified by The Elder-Ray strategy.
These are the details of the strategy.
- Download “ForexWOT-TheAvatarSystem” (Zip/RAR File).
- Copy mq4 and ex4 files to your Metatrader Directory …/experts/indicators/
- Copy the “ForexWOT-TheAvatarSystem.tpl” file (template) to your Metatrader Directory …/templates /
- Start or restart your Metatrader Client.
- Select Chart and Timeframe where you want to test your forex system.
- Right-click on your trading chart and hover on “Template”.
- Move right to select “ForexWOT-TheAvatarSystem” trading system and strategy.
- You will see the “ForexWOT-TheAvatarSystem” is available on your Chart.
![]()
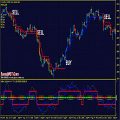
- The price is above the EMA line.
- Bears Power histogram is negative but moving closer to 0.
- The stochastic line crosses above the level 20 after being in the oversold area.
- Bulls Power histogram is above 0 and sufficiently high.
- Set the stop loss below the nearest swing low.
- This strategy has high accuracy, so set a minimum target profit of 3 times the stop loss.
![]()
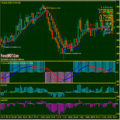
- The price is below the EMA line.
- Bulls Power histogram is positive but moving closer to 0.
- The stochastic line crosses below the level 80 after being in the overbought area.
- Bears Power histogram is below 0 and sufficiently long.
- Set the stop loss above the nearest swing high.
- Once again, as I mentioned earlier, this strategy has high accuracy, so set a minimum target profit of 3 times the stop loss.
General tips for using the Bulls Power and Bear Power indicators
- Use all system components together. Elder created the bulls and Bears Power indicators to be used together along with the 13-day EMA. They were not intended to function as standalone individual indicators.
- Test before going live. Before you use this system to trade with real money, make sure you backtest and demo test. Once you know you have the potential to be profitable, you can risk real money.
- Modify the system if you want, but again, test. You do not necessarily need to use Elder’s system exactly as he engineered it. But if you are going to make any changes, do not forget to test them first.


