Description:
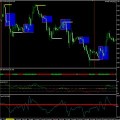
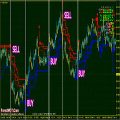
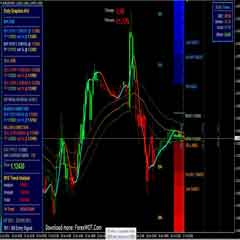
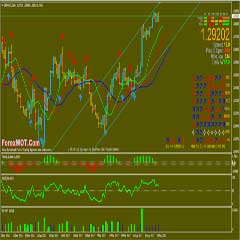
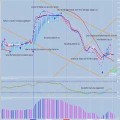
This indicator shows trend line and channels using the BSI Indicator.
First, it will check the trend by BSI. Then, draw the trend line or channels by condition. The trend line uses regression line, channels use tango line.

I’ve uploaded the compatible Tango Line indicator. I rewrote it again for this indicator.
Display:
- orange dash line— trend line or channel (high);
- blue dash line — trend line or channel (low);
- red mark — reversal bar (high);
- blue mark — reversal bar (low);
- pink line — this line is tango line (show the entry level);
- magenta line — moving average of tango line;
- red dot line — BSI value.
Images:


Setting:


