Easy Price Action Forex Trading Strategy and Analysis – BestForex Zig-Zag William’s Percent Range Oscillator Price Action Trading Strategy. Price action is encompassed in technical and chart pattern analysis, which attempt to find order in the sometimes seemingly random movement of price.

Technical analysis is a trading tool employed to evaluate securities and attempt to forecast their future movement by analyzing statistics gathered from trading activity, such as price movement and volume.
Unlike fundamental analysts who attempt to evaluate a security’s intrinsic value, technical analysts focus on charts of price movement and various analytical tools to evaluate a security’s strength or weakness and forecast future price changes.
Forex Zig-Zag William’s Percent Range Oscillator Price Action Trading Rules
The Williams Percent Range indicator is classified as an “oscillator” since the values fluctuate between zero and “-100”.
The indicator chart typically has lines drawn at both the “-20” and “-80” values as warning signals.
Values between “-80” and “-100” are interpreted as a strong oversold condition, and between “-20” and “0.0”, as a strong overbought condition.
The best BUY signal is above -50 level and SELL signal is below -50 level.
- Best Time Frame : 30minutes or higher
- Recommended Currency Pairs : GBPUSD, EURUSD, USDJPY, …All major pairs.
MetaTrader Trading Indicators
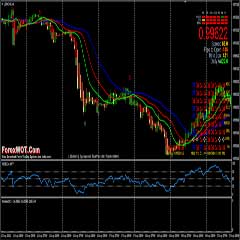
- Zig Zag rnp lenght 25 (yellow)
- Zig Zag rnp lenght 50 (Magenta)
- W%R (William’s Percent Range (14))
- ArZZX2 indicator (default setting)
- RSI (14)
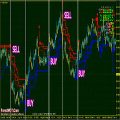
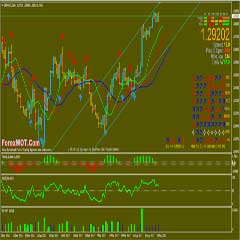
BUY Rules
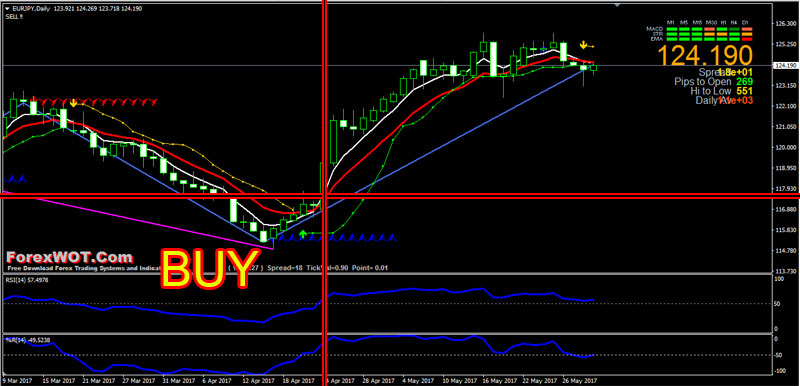
- Zig Zag rnp 25 or Zig Zag rnp 50 below the price
- Appears blue support of the ArrZZx2 indicator
- EMA 5 above EMA 10
- Green BBands Stop below the price
- BUY if RSI (14) upward above 50 level and William’s Percent Range upward above -50 level
SELL Rules
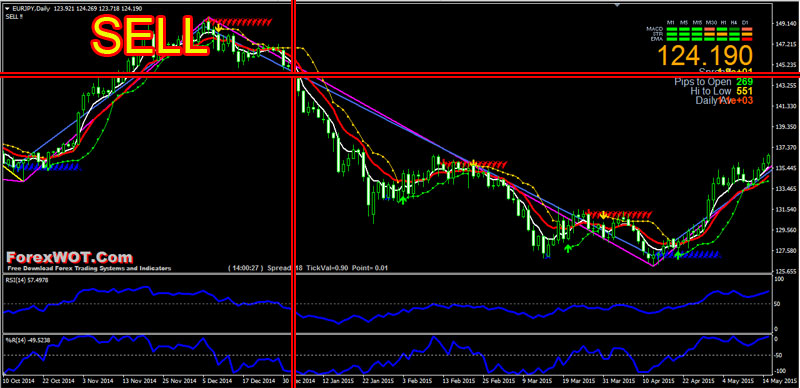
- Zig Zag rnp 25 or Zig Zag rnp 50 above the price
- Appears red resistance of the ArrZZx2 indicator
- EMA 5 below EMA 10
- Yellow BBands Stop below the price
- SELL if RSI (14) downward below 50 level and William’s Percent Range downward below -50 level
TRADING Note
Two basic assumptions of Dow Theory that underlie all of technical analysis are:
- Market price discounts every factor that may influence acurrency’s price and
- Market price movements are not purely random but move in identifiable patterns and trends that repeat over time.



Really … great strategy
thank you