Want to Increase Your Profitability?

Try this powerful approach. In this tutorial, we will delve into ‘Price Action Context,’ a proven technique that’s among the simplest and most versatile analytical tools applicable to all time frames and various financial instruments, including Forex, stocks, and cryptocurrencies.
So, mastering ‘Price Action Context’ is essential, as it has consistently proven to yield maximum profits and serves as a potent tool for bankers, fund managers, and all other institutional traders.
To begin, let’s establish the concept of ‘context‘.
Context is understanding and approaching a situation based upon the environmental variables around it.
So, Price action context in trading refers to the analysis and understanding of the current market conditions and the broader environment in which a financial instrument is traded. It involves evaluating various factors that can influence the price movement of an asset.
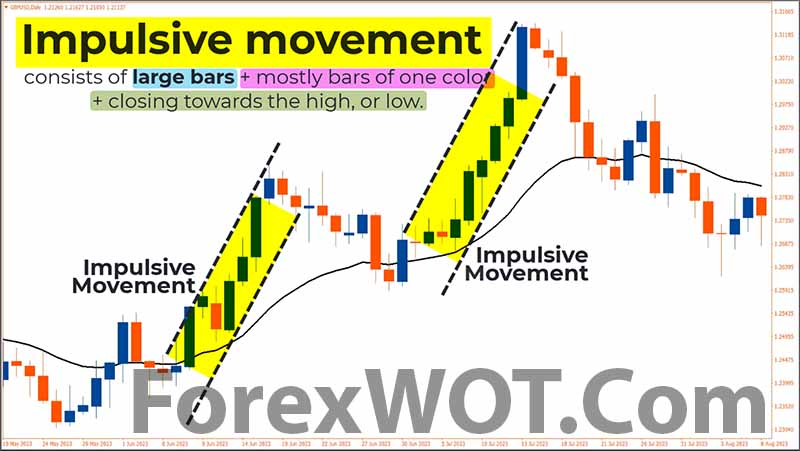
Impulsive moves is large bars + majority of bars 1 color + closes towards the highs/lows
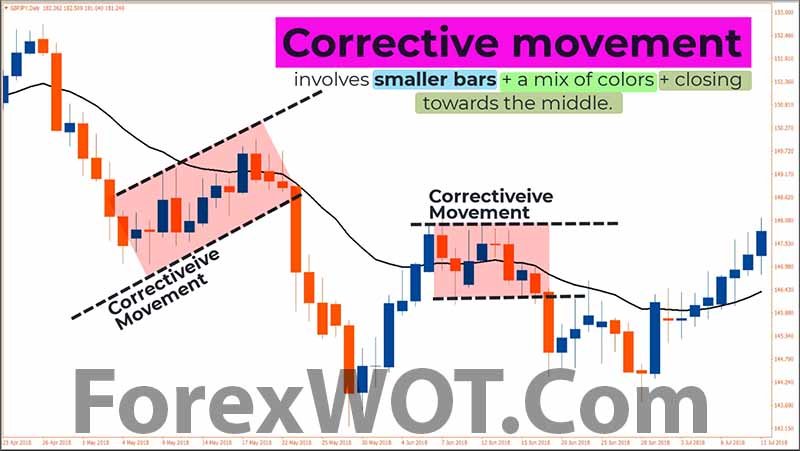
Corrective moves is smaller bars + mix of colors + closes towards the middle
In essence, impulsive and corrective movements effectively convey the context of price action, such as the underlying order flow.
During impulsive movements, the order flow is relatively ‘imbalanced,’ meaning it’s predominantly skewed to one side, either buying or selling, resulting in a strong directional move.
During corrective movements, the order flow is relatively ‘balanced,’ meaning there’s no strong winner between buyers and sellers, leading to mostly sideways market movements.
Fundamentally, the most crucial aspect in any trading strategy lies in the accuracy of the strategies we employ.
No matter how much you favor your trading strategy, it all becomes futile if the strategy possesses a low accuracy rate.
Hence, for the purpose of achieving high accuracy and reliability in trading, whether it be in the forex market, stock market, crypto market, or other securities markets, the most effective indicators to combine with the concept of Impulsive and Corrective Movements are RSI and the Moving Average. The period we utilize for this combination is 20, which means we are using a 20-period EMA and a 20-period RSI.
- Download “ForexWOT-RSIEMA(MarketContext)” (Zip/RAR File).
- Copy mq4 and ex4 files to your Metatrader Directory …/experts/indicators/
- Copy the “ForexWOT-RSIEMA(MarketContext).tpl” file (template) to your Metatrader Directory …/templates /
- Start or restart your Metatrader Client.
- Select Chart and Timeframe where you want to test your forex system.
- Right-click on your trading chart and hover on “Template”.
- Move right to select “ForexWOT-RSIEMA(MarketContext)” trading system and strategy.
- You will see the “ForexWOT-RSIEMA(MarketContext)” is available on your Chart.
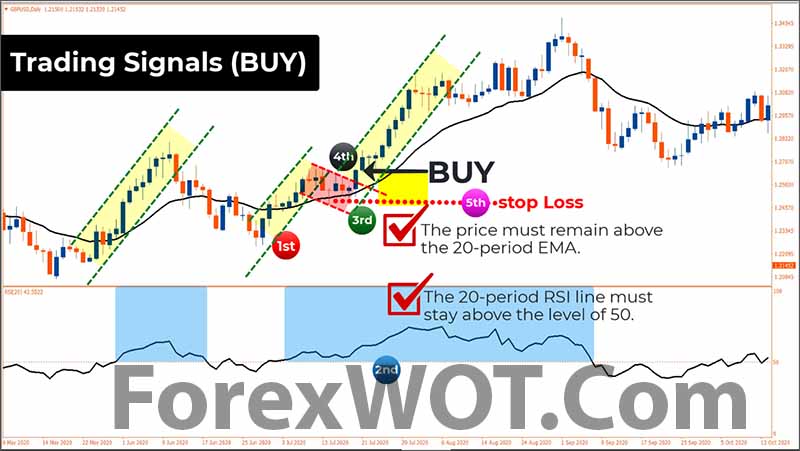
- 1st. The price is above the 20-period EMA line.
- 2nd. The 20-period RSI line is above the level of 50.
- 3rd. A Corrective movement is in progress. During this corrective movement, the price must remain above the 20-period EMA, and the 20-period RSI line must stay above the level of 50.
- 4th. Execute a BUY position when the price rises and breaks through the resistance line of the ongoing corrective movement.
- 5th. Place a stop loss just below the nearest swing low.
As you can see, an Impulsive Movement occurs, and the price continues to rise.
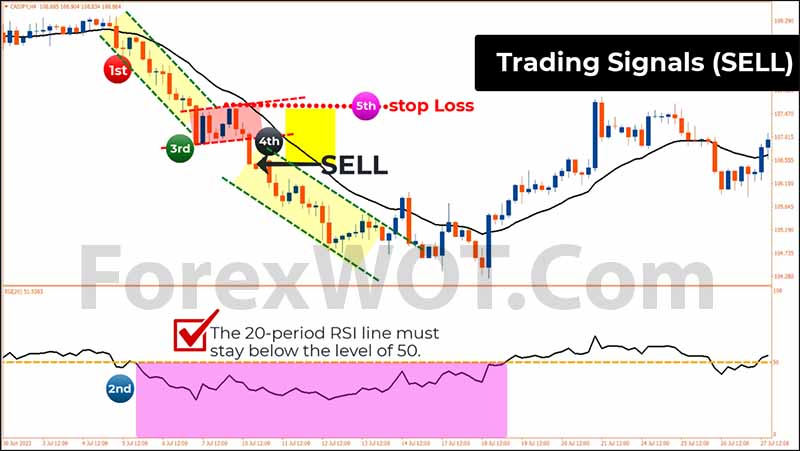
- 1st. The price is below the 20-period EMA line.
- 2nd. The 20-period RSI line is below the level of 50.
- 3rd. A Corrective movement is forming. During this corrective movement, the price must remain below the 20-period EMA, and the 20-period RSI line must stay below the level of 50.
- 4th. Initiate a SELL position when the price falls and breaches the support line of the ongoing corrective movement.
- 5th. Place a stop loss just above the nearest swing high.
As you can see, an Impulsive Movement occurs, and the price continues to decline.
Keep in mind, trading with price action context is a skill that works on any instrument, time frame or environment.
If you’re learning a price action strategy or approach that only works on specific time frames, then it’s a limited strategy that doesn’t really understand price action context.
 20 Halloween Costumes From Amazon All Traders will Actually Want To Wear
 2 MACD Effortless Forex & Stocks Swing Trading Strategy
 FREE DOWNLOAD 20+ Best Forex MACD-Moving Average Trading System
 Advanced Moving Average Forex Trading Tutorial – How To Become A Successful Forex Trader With Moving Average Indicator
 MA COBRA Forex & Stocks Trading Strategy (Extremely Low Risk High Reward Trading Strategy) (COBRA SYSTEM)
 Foreign Exchange Trading : Online Forex Master Level Trading System and Strategy
 Forex and Crypto “MORNING TRADE” Trading Strategy for Advanced Traders
 Forex Profit Booster Trading Strategy – Most of The Time it Doesn’t Give False Signals
 FOREX 1 MIN Scalping Trading Tricks By The Most Successful Forex Trader
 TOP10 BEST Full Time Forex Trader Trading System and Strategy
