High accuracy “MAGIC Rainbow MA Forex Trading System and Strategy” – A Basic Method of Identifying Probable Trends. One of the better ways to identify trend direction is the use of moving averages.
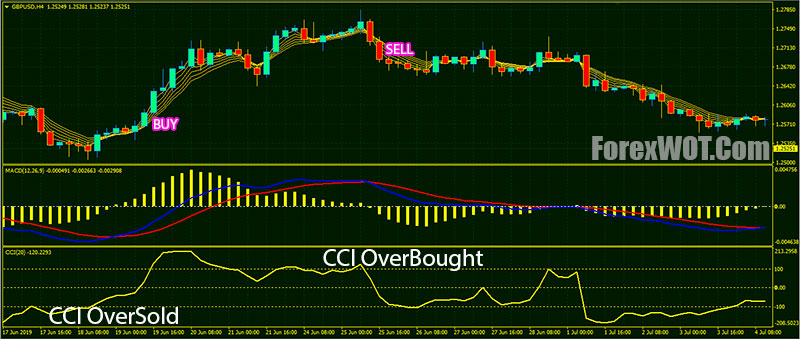
When you come to think of it, trending markets is basically a market wherein price is consistently rising or falling.
This constant rise or fall in price would cause its average to rise or fall along with it.
In the context of a Moving Average, it will cause it to slope either up or down.
- Time Frame: M5 or higher
- Currency Pairs: Any
As an additional confirmation, we will also be using the MACD and CCI.
We will be taking BUY signals only when the faster MACD is above the slower MACD.
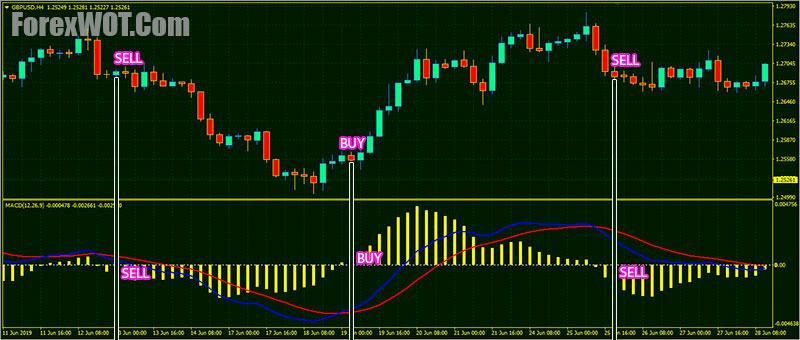
This is also shown through histograms based on whether it is positive or negative. Flip it over for the filter on SELL signals.
The direction of the CCI line shows the trend. If it moves up, the market is in an uptrend. If the CCI line is heading downwards, the market is bearish.
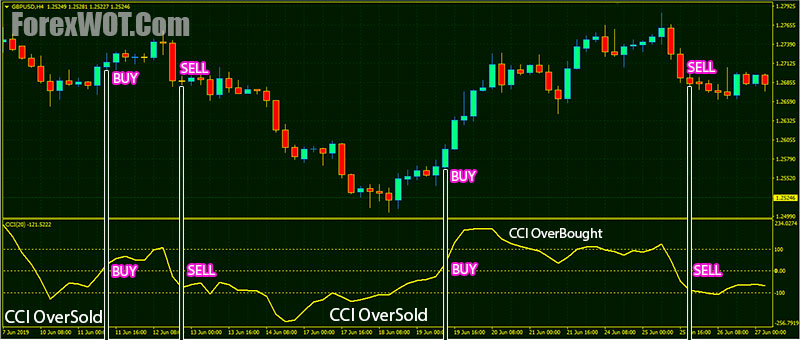
The overbought/oversold zones are extremes of price action.
They are seen in the CCI indicator window as the extreme areas, usually above 100 (overbought) and below -100 (oversold). Reversal of price action is possible at price extremes.
- Download “ForexWOT.Com-MagicRainbowMA” (Zip/RAR File).
- Copy mq4 and ex4 files to your Metatrader Directory …/experts/indicators/
- Copy the “ForexWOT.Com-MagicRainbowMA.tpl” file (template) to your Metatrader Directory …/templates /
- Start or restart your Metatrader Client.
- Select Chart and Timeframe where you want to test your forex system.
- Right click on your trading chart and hover on “Template”.
- Move right to select “ForexWOT.Com-MagicRainbowMA” trading system and strategy
- You will see “MAGIC Rainbow MA Forex Trading System” is available on your Chart
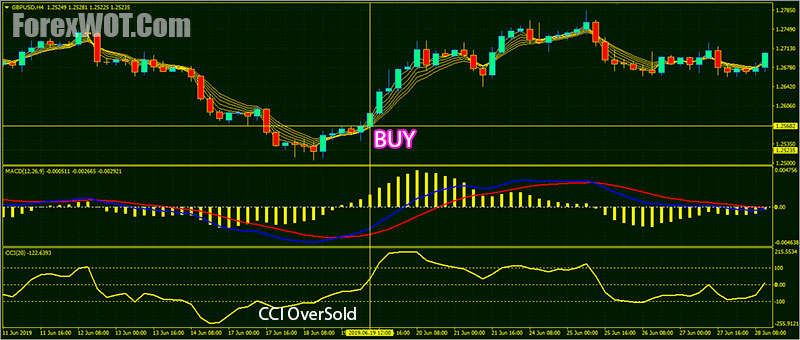
- Rainbow MA: Price closed above the Rainbow MA
- RealMACD: The RealMACD histograms should be positive
- CCI line: upward above the level zero line from the oversold area
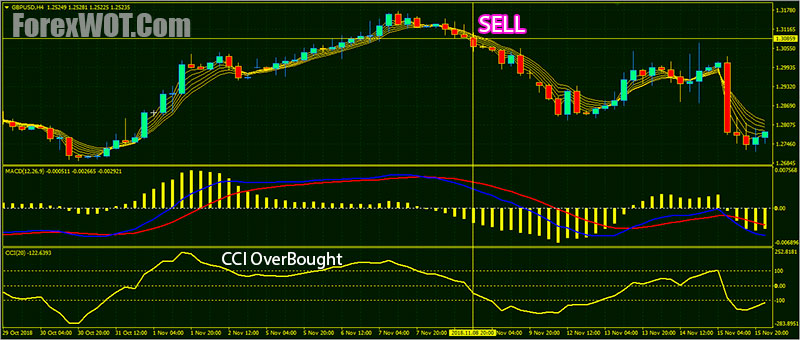
- Rainbow MA: Price closed above the Rainbow MA
- RealMACD: The RealMACD histograms should be positive
- CCI line: upward above the level zero line from the oversold area
By adding the RealMACD histogram filter, we are able to have a double confirmation with regards to the trend.
By adding the CCI filter, we are able to see the extreme areas, usually above 100 (overbought) and below -100 (oversold). Reversal of price action is possible at price extremes.
This strategy is excellent for catching trends during a trending market.
However, it is not the best strategy to use during low volatility ranging markets.
Remember, we are here to ride the big waves, not just bob up and down on the small waves.
[sociallocker]
[/sociallocker]


