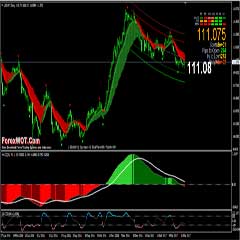
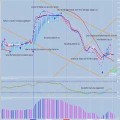
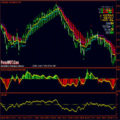
FREE DOWNLOAD Super Simple and Effective Trading System To Detect the End of a Trend – Today we will look at the signs that a trend may be dying out, and how you can benefit from the end of the trend with this trading End of a Trend system.
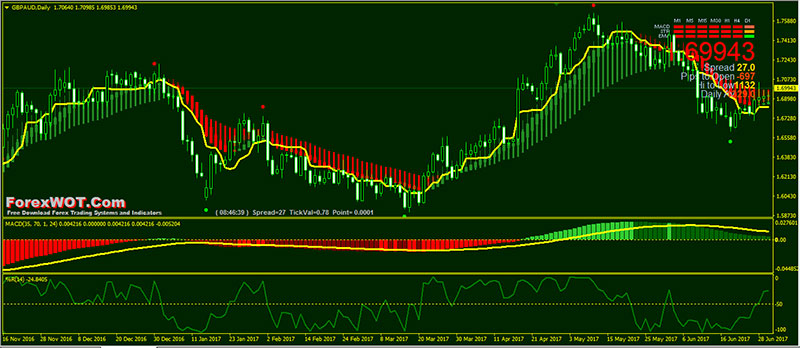
WHY YOU SHOULD KNOW IF A TREND HAS ENDED?….
If you are using a trend trading Forex system, would’t it be important that you must be always trading in the direction of the trend?
But if you take a trade at the very start of a new trend (which is the end of the previous trend), you stand to make a lot more money (profits) if the trend is strong and continues with a strong momentum.
Or if you can just find a way to get into a trade just after a new trend has started, you also stand to make a lot more profits if the trend is strong and continues for a long time.
WHERE DO TRENDS END?
Trends can end anywhere! But they can also end at:
- Support or resistance levels
- Fibonacci levels
- Touch of trend lines
- etc
Now, if you can enter a trade at the very start of a new trend (which would be the end of the previous trend), it would be like picking tops and bottoms, right?
Exactly!
But it’s not easy.
Some traders will say that say that picking tops of bottoms of trends is a myth, it can’t be done.
SHI “End of a Trend” Signal indicator is our best solution to catch the end of the trend.
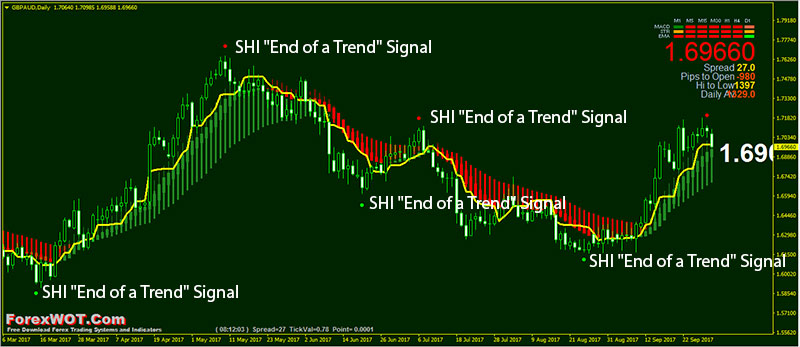
And this trading system is about how to catch the end of the trend and than enter a trade at the very start of a new trend.
Did you know that you do not need price action structure analysis to determine if a trend is ending or not like breakouts of highs and lows?
Is this something new I’m going on about here?
No, I don’t think so. The fact of the matter is that you may have seen it… Let’s go to the rules…
ForexWOT End of a Trend Trading is a high accuracy trading system & strategy that you can use to generate profits from Forex market every month.
It was designed to be very simple and very powerful at the same time.
You don’t have to be an experienced trader to be able to use it.
- Best Time Frames: H1, H4, and Daily
- Recommended Currency Pairs: GBPUSD, EURUSD, GBPJPY, and all major pairs
- SHI Signal
- Rads HAS Ext
- Rads HAS
- Signal Trend
- Tenkan-Sen Ichimoku Kinko Hyo
- QFF MACD
- Williams’ Percent Range
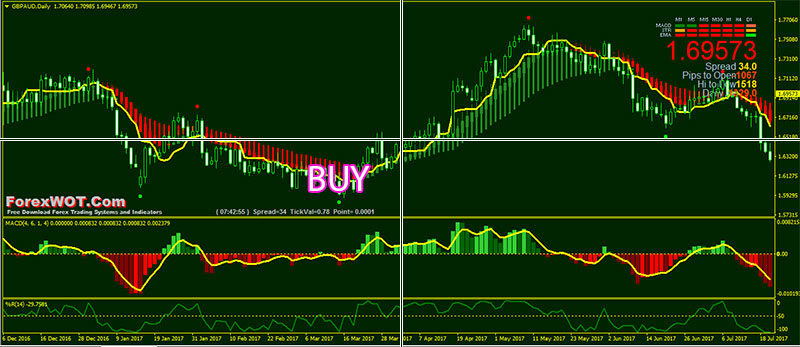
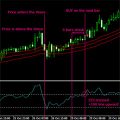
- SHI “End of a Trend” Signal (Green dot) below the bullish candles
- Price above upward Tenkan-Sen line
- Wave indicators, Rad HAS and Rad Has Ext bars/candles are green (that means it’s a BUY signal or bullish wave).
- QFF MACD is showing green bars above 0 level.
- Williams’ Percent Range line upward and above -50 level
- Signal Trend green color bars
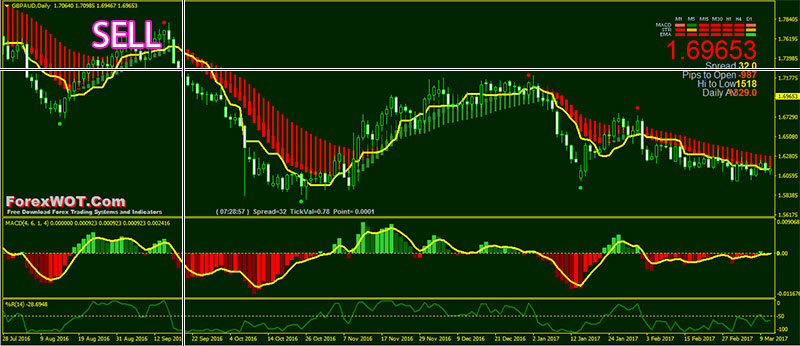
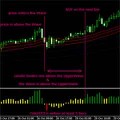
- SHI “End of a Trend” Signal (Red dot) above the bearish candles
- Price below downward Tenkan-Sen line
- Wave indicators, Rad HAS and Rad Has Ext bars/candles are red (that means it’s a SELL signal or bearish wave).
- QFF MACD is showing red bars below 0 level.
- Williams’ Percent Range line downward and below -50 level
- Signal Trend red color bars
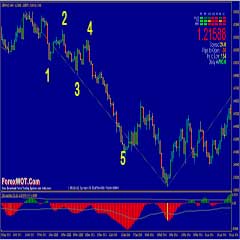
SHI “End of a Trend” Signal indicator – when you see a red dot on the top of the current wave that means a SELL signal. When the dot is green and located at the bottom of the current wave that means the signal is a BUY signal.
The dots calculate highs and lows, that’s why sometimes they will re-locate their place or “REPAINT” when a new high/low is formed. But that’s NOT A PROBLEM.
[sociallocker]
[/sociallocker]


