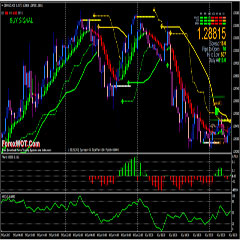
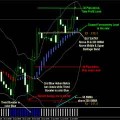
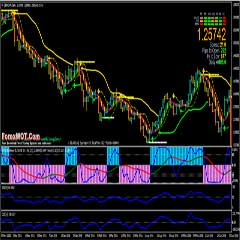
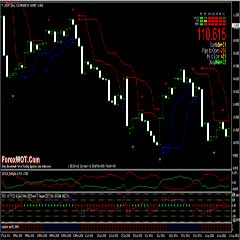
Forex Triple CCI Trading Strategy – Forex Triple CCI Trading System and Strategy With BBands Stop Indicator is based on the CCI and Fisher function with other indicators trend following.

Commodity Channel Index (CCI) – Developed by Donald Lambert and featured in Commodities magazine in 1980, the Commodity Channel Index (CCI) is a versatile indicator that can be used to identify a new trend or warn of extreme conditions.
Lambert originally developed CCI to identify cyclical turns in commodities, but the indicator can successfully applied to indices, ETFs, stocks and other securities. In general, CCI measures the current price level relative to an average price level over a given period of time.
CCI is relatively high when prices are far above their average. CCI is relatively low when prices are far below their average. In this manner, CCI can be used to identify overbought and oversold levels.
In general, CCI measures the current price level relative to an average price level over a given period of time.
- BBands Stop dots turns into blue color;
- Heiken Ashi Smoothed alert candles turn into blue;
- TRO Multimeter BarColor all red
- Inverse Fisher Trasform of RSI indicator goes above 0 line;
- Go Long whenTriple CCI green and all above 0 line.

- BBands Stop dots turns into red color;
- Heiken Ashi Smoothed alert candles turn into red;
- TRO Multimeter BarColor all red
- Inverse Fisher Trasform of RSI indicator goes below 0 line;
- Go Short whenTriple CCI red and all below 0 line.
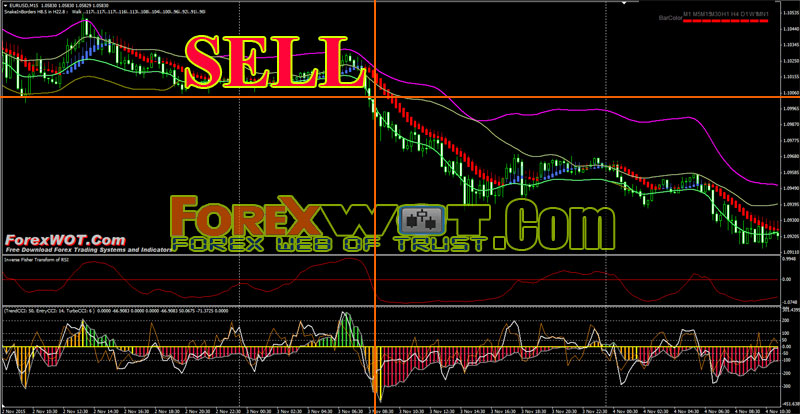
Only enter trade with all indicators confirmation for perfect signal. You should put stop loss on previous candle high or low. Also trailing stop could be applied or Profit Target predetermined (time frame: 15 min 20 pips, time frame 60 min 30-40 pips, time frame daily 70-80 pips).
We simply exit trade when Bollinger Bands indicator changes color against our trade.


