The term “Moving Averages” is widely employed within the realm of financial analysis, and almost everyone has a basic comprehension of what they are and how they are used.


Yet few truly understand the intricacies of moving averages and the many ways they can be used to maximize trading profits in the financial markets.
A growing interest among the investing public about Moving Averages has spawned a number of books on the subject in recent years.
I write this article with the hope that it will go far in aiding the serious trader or investor about the proper way of incorporating moving averages into his or her market analysis.
A moving average is an indicator that shows the average value of a security’s price over a period of time.
When calculating a moving average, a mathematical analysis of the security’s average value over a predetermined time period is made.
As the security’s price changes, its average price moves up or down.
Recommended Moving Average Articles and Trading Systems:
The five most commonly used types of moving averages are the simple, or arithmetic; the exponential; the triangular; the variable; and the weighted moving average.
Moving averages can be calculated on any data series, including a security’s open, high, low, close, volume, or other indicators.
A moving average of another moving average is also commonly used in various forms of technical analysis.
This technique is used for purposes of tracking the price momentum of a stock or commodity and is constructed by averaging the moving average of the price being followed.
The only significant difference between the various types of moving averages is the weight assigned to the most recent price data.
- Simple moving averages apply equal weight to the prices.
- Exponential and weighted averages apply more weight to recent prices of the stock or commodity being followed.
- Triangular averages apply more weight to prices in the middle of the time period.
And variable moving averages change the weighted based on the volatility of prices.
Steven B. Achelis, in his book, Technical Analysis From A to Z, has written one of the most lucid explanations of moving averages that we have read, which we quote from at length:
The most popular method of interpreting a moving average is to compare the relationship between a moving average of the security’s price with the security’s price itself.
A BUY signal is generated when the security’s price rises above its moving average, and a SELL signal is generated when the security’s price falls below its moving average.

This type of moving average trading system is not intended to get you in at the exact bottom nor out at the exact top.
Rather, it is designed to keep you in line with the security’s price trend by buying shortly after the security’s price bottoms and selling shortly after it tops.
The critical element in a moving average is the number of time periods used in calculating the average.
When using hindsight, you can always find a moving average that would have been profitable…
The key is to find a moving average that will be consistently profitable.
The MOST POPULAR Moving Average is the 39-week (or 200-day) moving average.
This moving average has an excellent track record in timing the major (long-term) market cycles.
The length of a moving average should fit the market cycle you wish to follow.
For example, if you determine that a security has a 40-day peak-to-peak cycle, the ideal moving average length would be 21 days calculated using the following formula:

Moving averages can also be calculated and plotted on indicators.
The interpretation of an indicator’s moving average is similar to the interpretation of a security’s moving average:
- When the indicator rises above its moving average, it signifies a continued upward movement by the indicator;
- When the indicator falls below its moving average, it signifies a continued downward movement
by the indicator.
Indeed, many and varied are the uses for moving averages, whether used on prices or technical indicators of prices.
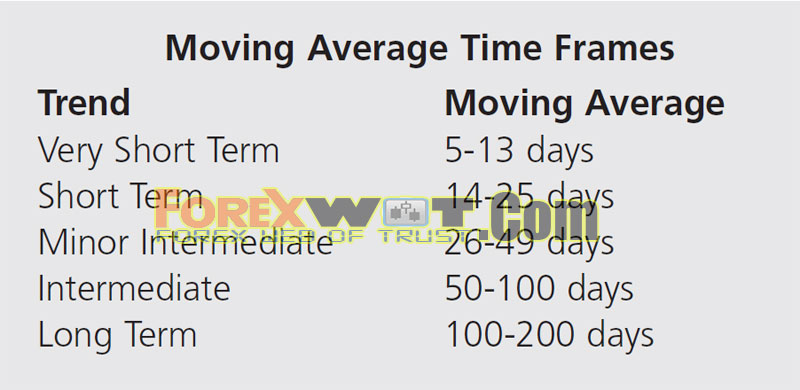
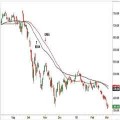
Below are simple moving averages of short-term and intermediate-term time frames.
For example, I’ll show you a trend trading strategy with Most Popular Moving Averages.
A trend trading strategy and rules with Most Popular Moving Averages to maximize your profits.
If Technical Analysis is the attempt to forecast future price trends then Moving Averages is a worthy start.
Once you understand moving averages, you can then apply two or more moving averages and find an entry and exit based on them.
In this article, we will learn high accuracy Moving Averages trading system.
This Moving Averages trading system is a complete strategy trend momentum with more filters.
This trading system is a complete strategy trend momentum with more filters. You can trade intraday or swing. This strategy is discretionary.
- Best Time Frames: H1, H4, or higher
- Financial Markets: Indices, Currency pairs, and Commodities
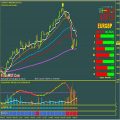
This ForexWOT Moving Averages Trend Trading System is simple to use and can be effective in recognizing trending, ranging, or corrective environments so that you can be better positioned for the next move.
- Exponential Moving Averages
- Strength Candles
- Signal Trend
- 3 Level ZZ Semafor
- FVT Signal
- 1 indicator
- 2 indicator
- SSL Fast
- Stoch Tape
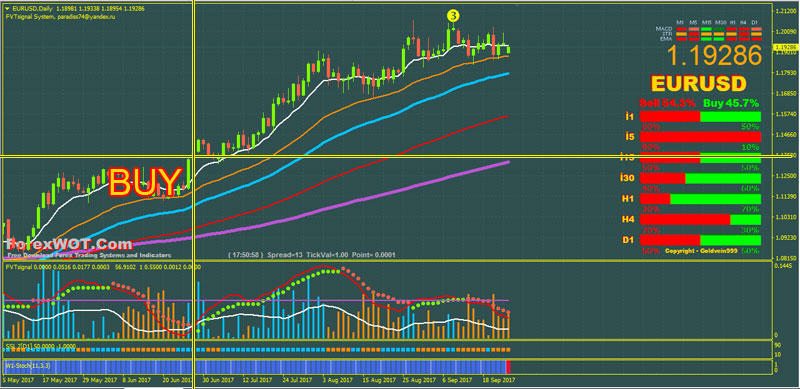
- Moving Averages BULLISH FORMATION (200EMA< 100 MA < 50EMA, 30 EMA, and 10EMA)
- Indicator 2 green dot
- FVT Signal aqua bar
- Stoch TapeBlue color
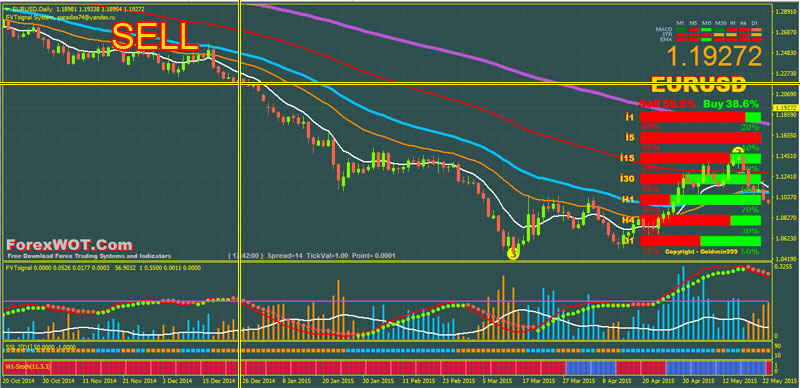
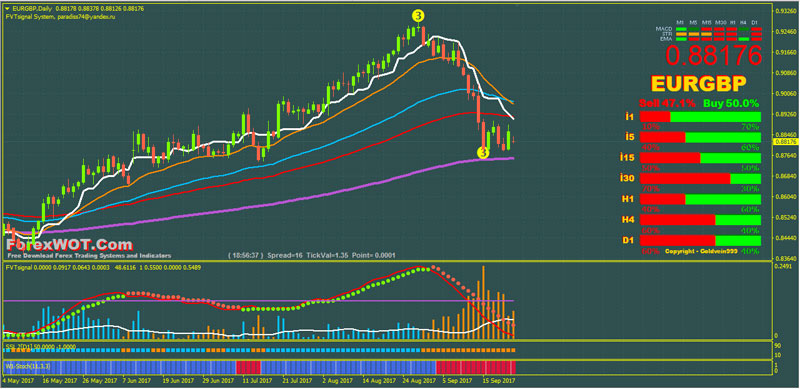
- Moving Averages BEARISH FORMATION (200EMA> 100 MA > 50EMA, 30 EMA, and 10EMA)
- Indicator 2 red dot
- FVT Signal maroon bar
- Stoch Tape Red color
Risks of using a Moving Average Crossover Strategy
Although this is seen as the simplest trading strategy, the Moving Average Crossover for following trends is not without drawbacks.
The moving averages give equal weighting to all prices within the period selected when applying the indicator so there is a LAGGING nature to the indicators ability to respond to changes in price.
When there is a slower response time, this could mean that you’re sacrificing less reward and opening yourself up to greater risk.
 FREE DOWNLOAD 20+ Best Forex MACD-Moving Average Trading System
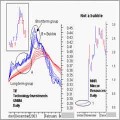 Stocks and Currency Trading With GUPPY Multiple Moving Averages Trading System
 FREE DOWNLOAD Top 10 Super High Profits Moving Average Forex Trading System
 The Benefits of Using Moving Averages in Forex Trading
 Trend Trading with Most Popular Moving Averages Technical Analysis
 How To Use Moving Average in Forex Trending (Moving Averages as Trend Filters)
 MA COBRA Forex & Stocks Trading Strategy (Extremely Low Risk High Reward Trading Strategy) (COBRA SYSTEM)
 Forex Multiple Moving Averages Trading Strategy To Identify Shorter and Longer Term Trends
 Top 10 Super Effective High Profits Forex Heiken Ashi Trading System and Strategy
 BEST Forex Technical Analysis – A Winning Strategy Using Moving Averages Forex Trading System
