In 2013, a broker in London reported that one of its customers had the highest trading volume for eight straight years. That customer was Paul Rotter, a successful scalping trader who averaged trading 3 million lots every month and made between $65 to $78 million annually.


Paul Rotter’s trading success began when he and his friend Kinski started a financial firm called GreenHouse. With an initial investment of $526,000, GreenHouse made a profit of $6.5 million within just three months.
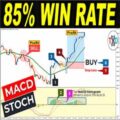
Paul Rotter’s scalping strategy is a great example for all scalping traders. The key to his success lies in his scalping techniques. If you want to achieve success like Paul Rotter, this tutorial will show you the best SCALPING strategies that you can use and develop to reach your own trading goals.
This strategy helps us avoid choppy markets and lets us capture gains before confirming a break of the 0 line.
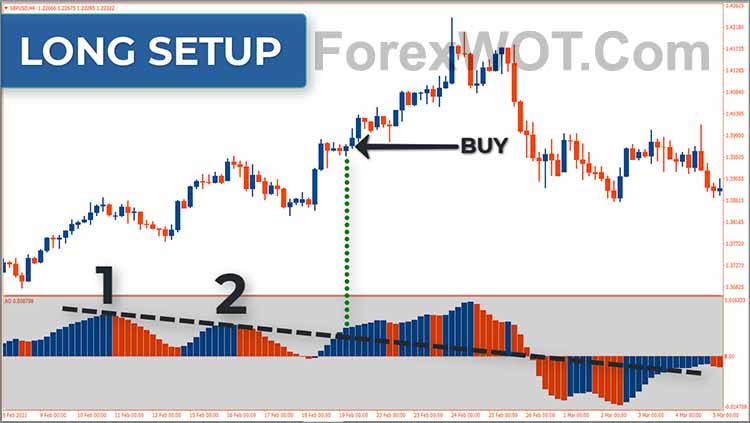
- 1st. The Awesome Oscillator shows two swing highs above the 0 line.
- 2nd. Draw a trendline connecting these two highs, extending through the 0 line.
- 3rd. Buy when the price breaks the trendline.
In the example shown, by entering a trade when the trendline is broken, you can benefit from more gains before the price crosses above the 0 line.
Make sure the downward-sloping trendline is drawn using two swing points of the Awesome Oscillator, with the second point being low enough to create the trendline.
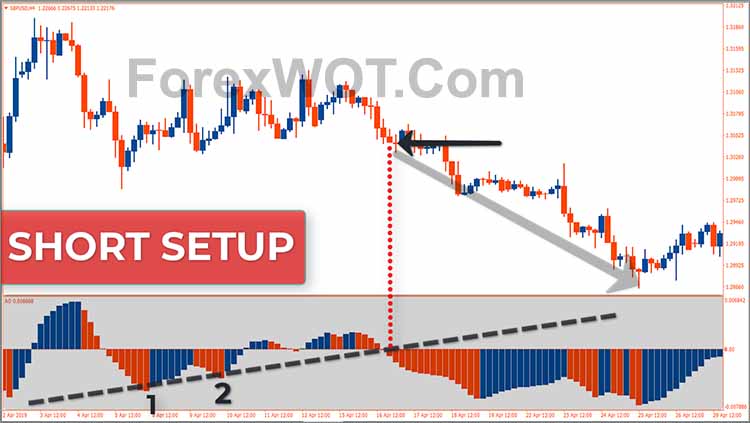
- 1st. The Awesome Oscillator shows two swing lows below the 0 line.
- 2nd. Draw a trendline connecting these two lows, extending up through the 0 line.
- 3rd. Sell short when the price breaks the trendline.
In the example provided, the trendline was broken at the same time the Awesome Oscillator crossed below the 0 line.
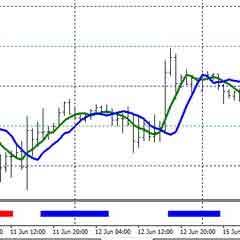
We use MACD in combination with 5, 8, and 13 EMA lines in our SCALPING and INTRADAY trading strategy. EMA lines will act the same as the Long-term strategy. This strategy works fine in any time frame chart.
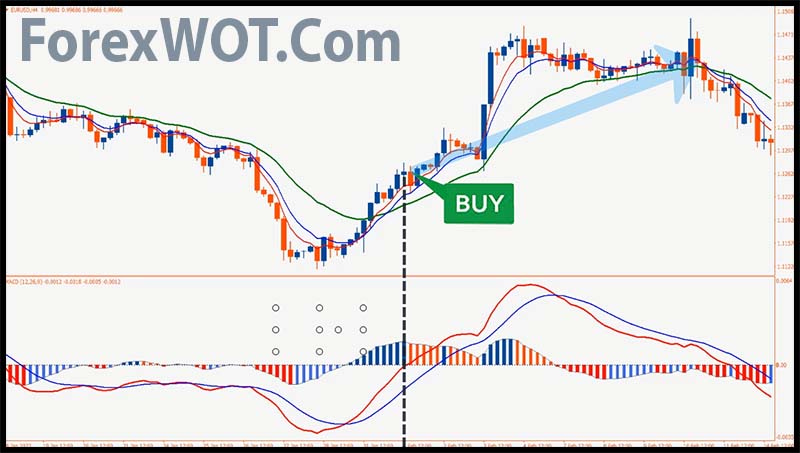
Enter buy order when:
- 1st. A bullish crossover occurs between the EMA signal lines.
- 2nd. The blue signal line crosses above the red signal line, and both lines are heading toward the upside in the MACD indicator window.
- 3rd. MACD histogram bars appear above the middle line of the MACD window.
while its red line crossing above the 0 level, it is an indication that price is pushing higher and does make sense to enter a buy.
The initial stop loss will be below the recent swing low.
Close the buy position when:
- 1st. MACD histogram bars appear below the middle line.
- or 2nd. The red, (5 EMA line), crosses below other EMA lines.
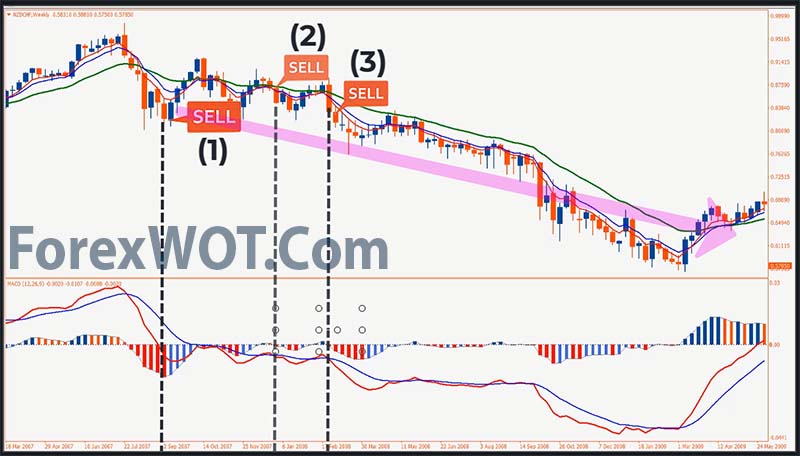
Enter sell order when:
- 1st. A bearish crossover occurs between the EMA signal lines.
- 2nd. The blue signal line crosses below the red signal line, and both lines are heading toward the downside in the MACD indicator window.
- 3rd. MACD histogram bars appear below the middle line of the MACD window.
while its red line crossing below the 0 level, it is an indication that price is pushing lower and does make sense to enter a sell.When these conditions are true, place a sell order. The initial stop loss will be above the recent swing high.
Close the sell position when:
- 1st. MACD histogram bars appear above the middle line.
- or 2nd. The red (5) EMA crosses above other EMA lines.
Let’s wrap up by looking at the CCI strategy. It’s a bit more advanced, but it works well for both beginners and experienced traders in Forex and Stock markets. This strategy is powerful and reliable, and you can use it for Scalping, Intraday, and Swing Trading. Beginners will find it easy to follow with its clear entry and exit rules, while pros can tweak it for even better results. Just use the default settings for the CCI and MACD indicators.
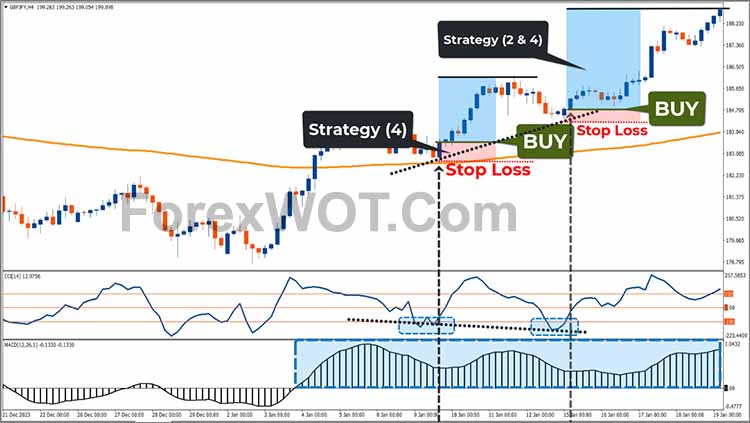
For BUY orders, follow these steps:
- 1. The MACD histogram is above 0, showing a bullish trend.
- 2. The CCI moves out of the oversold zone and goes above -100.
- 3. Place a BUY order with a stop loss set below the nearest swing low.
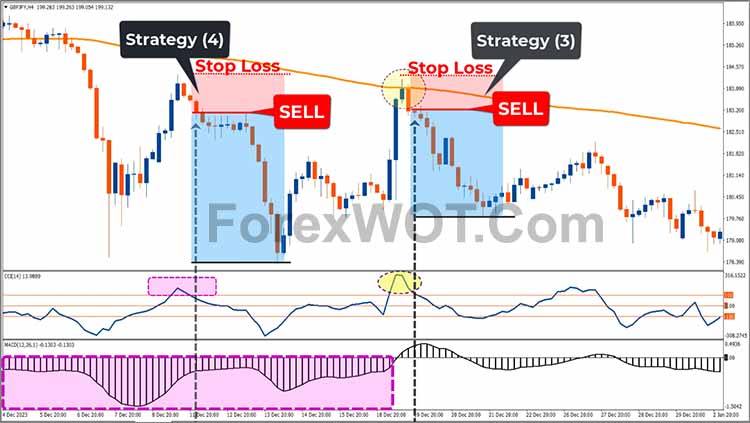
For SELL orders, use these conditions:
- 1. The MACD histogram is below 0, indicating a bearish trend.
- 2. The CCI moves out of the overbought zone and falls below +100.
- 3. Place a SELL order with a stop loss set above the nearest swing high.
This strategy works well for both Forex and Stock trading. Check out more examples of the Integrated CCI and MACD trading strategy to get a better grasp and make the most of it.
 2 MACD Effortless Forex & Stocks Swing Trading Strategy
 How to Do Accurate Forex Trend Line Analysis
 FOREX 1 MIN Scalping Trading Tricks By The Most Successful Forex Trader
 Foreign Exchange Trading : Online Forex Master Level Trading System and Strategy
 MA COBRA Forex & Stocks Trading Strategy (Extremely Low Risk High Reward Trading Strategy) (COBRA SYSTEM)
 Forex & Stock Heikin Ashi SCALPING Trading Strategy
 FREE DOWNLOAD 20+ Best Forex MACD-Moving Average Trading System
 Best LWMA Trading With MACD & STOCHASTIC Filter
 TOP10 BEST Full Time Forex Trader Trading System and Strategy
 Forex Currency Trading Course : How to Trade Forex Successfully with U-TURN Cross Over Trading System
