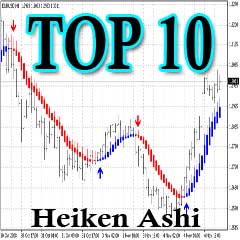
FREE DOWNLOAD Very Profitable Forex Heiken Ashi candles TDI Stochs Trading Method – I am a price action trader by nature and have always resisted indicators overall, but the reality is even a Japanese candlestick is an indicator.
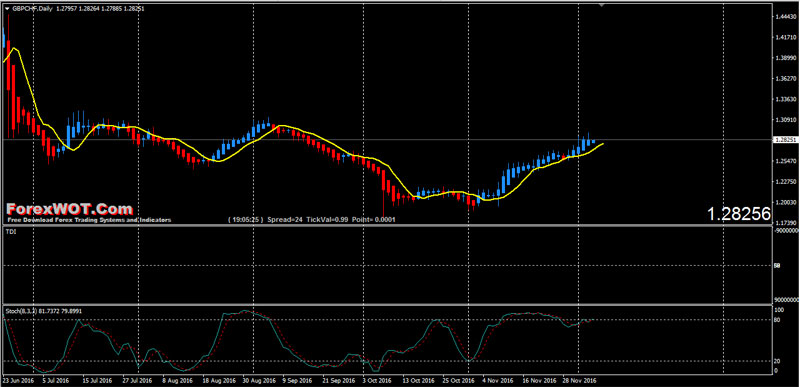
The nice thing about Heiken Ashi candles is that you can apply price action analysis to them to get a good idea of where price may go. Price action for an Heiken Ashi chart is a little different but there are some similarities.
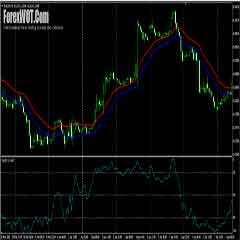
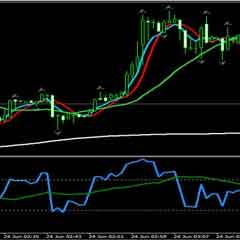
Forex Heiken Ashi candles TDI Stochs Trading Method
Timeframe: 4H or 1H (the original author trades 4H I prefer 1H)
Pairs: Any pair you are comfortable with
Indicators:This method uses Heiken Ashi candles + TDI +Stochs for conformation
I will attach a template file for MT4 to simplify things.
- Bottom line with this Heiken Ashi candles TDI Stochs method
It is very simple it can be used on any timeframe and with any pair but I feel reliability would be much lower on lower time frames.
What we are looking for first and foremost is a cross of the TDI indicator.
- If the green line crosses up through the red line we are looking to BUY.
- If the green line crosses down through the red line we are looking to SELL.
Also note where the TDI is. It is a much better signal to sell if the TDI is coming up from under the 50 line and a much better signal if the tdi is coming down from above the 50 line.
Second thing we look for is Stochastics. We are only using Stochs for confirmation.
- If they are oversold and pointing up than it confirms the BUY.
- If they are overbought and turning down it confirms the SELL.
Third we have a 5ema on the chart but that is just visual and not really used.


